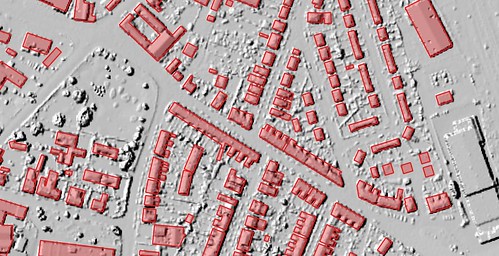
SK data. Co-incidentally Christian Ledermann had asked on talk-gb about using this data to add buildings to OpenStreetMap for Newark-on-Trent. A little earlier the Environment Agency had released Lidar data for England, and this is also useful as input for mapping buildings.
OpenMap Local
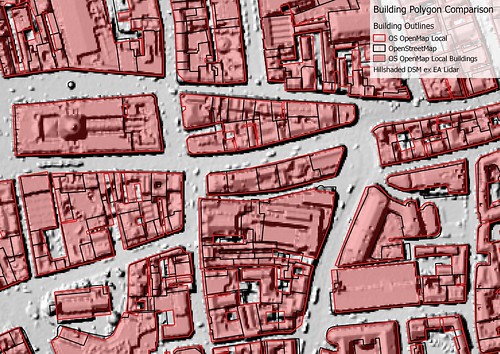
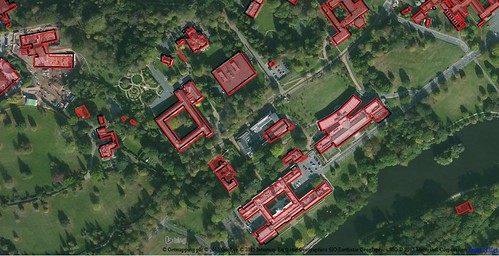
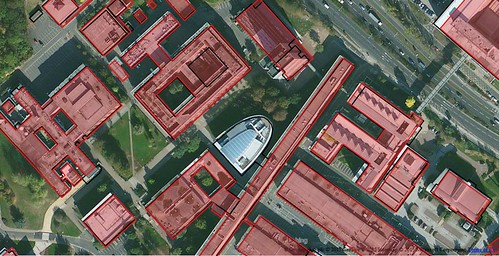
Apart from the area I originally needed which were in SK41 (no buildings in OSM), I've also looked at areas which I know much better & compared some selected areas where we have good building coverage around Nottingham. The comparisons I made are shown visually, with my main observations summarised at the end. Note that comparisons have not been made on any systematic basis.- Best for larger buildings. The data seem much more reliable (actually matching building footprints fairly well) for larger buildings. Even for large detached houses I would regard the data as unreliable: on our road of 40 detached houses, at least 16 are represented as terraces (SK5439). Similar artefacts occur in other areas with detached houses: apparently caused when a garage is close to both houses. Smaller houses are inherently simplified: no better than drawing one in JOSM and then copying the outline in fact.
- Building fusion. This is particularly clearly seen in the city centre image, where a whole block of buildings has been simplified to a single building (centre of image), but also occurs in suburban housing (see above).
- Inconsistency in geometry simplification. This is most noticeable in the city centre. (SK5739). For instance compare the OSM and the OpenMap Local outlines for St Peter's Church (bottom right in map above). In OpenMap Local the church is just shown as a rectangle, whereas in practice it is more complex. Modern buildings on the Jubilee Campus of Nottingham University are generally shown with more detail.
- Inconsistency in building size. In SK5439 there are a very large number of houses which were identical when built. However, in the OpenMap Local they are often of different sizes. (This is also probably true of OSM, if buildings have not been created by duplication).
- Voids. Gaps between closely packed buildings in the city centre appear slightly arbitrary in both placing and whether such a void exists or not.
- Some selection inconsistency with small size buildings. Only 2 garages are shown in an area of around 500 houses. With OSM the figure is nearer 200+. (SK5439)
- Demolished buildings. Whilst I would not expect the data to show the building demolished in the past month, I would expect it to not show one demolished 2 years ago, and I would certainly expect it not to show one demolished in 1970 (although MasterMap shows this too). (SK5439)
- Better locational accuracy. If using the full transform it may be useful to take advantage of the better locational accuracy of this data. In the main OSM buildings are rarely more than 3 m displaced from the OS OpenMap Local. (SK5439) In general the more recently mapped buildings in Nottingham city centre have better locational accuracy than this (SK5739).
- Selective transfer of larger buildings (schools, offices, public buildings, factories, warehouses, larger shops) on a case-by-case basis from a shapefile to a JOSM editing layer, or to Potlatch 2. Some minor refinement will probably be needed (for instance a university building here has long narrow courtyards which act as light wells which are not shown in OpenMap Local.
- Only use it for houses and similar when shapes are very simple and everything has been double checked, at the very least, against aerial imagery. For simple shapes it's as quick to draw & copy in JOSM anyway. A similar principle holds for more complex building shapes on modern estates, where one building can be cloned.
- Watch out for demolished buildings. This requires not just checking against Bing/MapBox imagery, but some local knowledge for sense checking.
Environment Agency Lidar Data
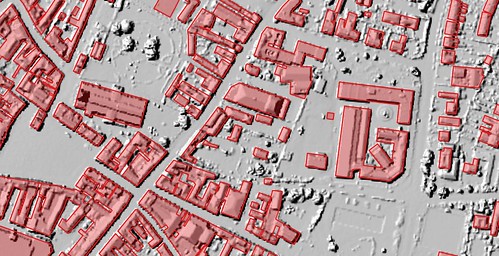
Another source of building data is the recently released Environment Agency Lidar data. This does not cover the whole country, and in many places may only be at 1 or 2 m resolution. It may also be quite old. However, because it does not suffer from parallax artefacts it can be used in conjunction with both aerial imagery (whether from Bing, MapBox or more local sources) and OS OpenData. I have provided examples from Nottingham, Newark, and Melton Mowbray of this data, combined with one or more of OSM buildings data, OS OpenMap or Bing aerial imagery.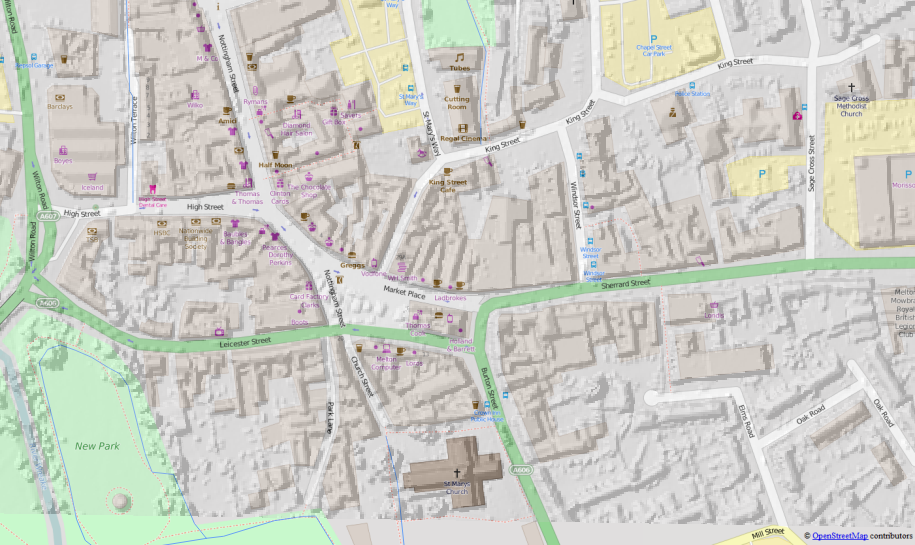 |
| Melton Mowbray. EA Lidar DSM (1m) overlaid on OSM. The Lidar data was used to refine the OSM building outlines which originally were traced from OS StreetView as block-sized polygons. (see commentary) |
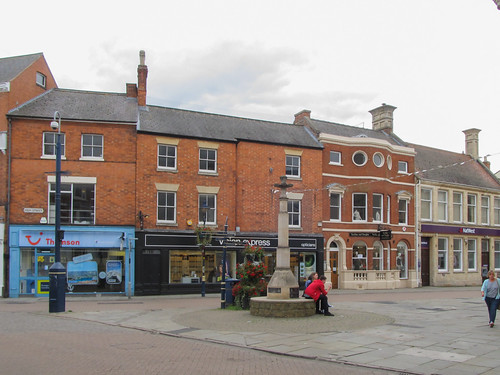 |
| Butter Cross in Market Place, Melton Mowbray Despite the different styles & ages of the buildings, several have long ranges at the rear. |
The Lidar data also allows one to do some other things: notably find building heights. I've done this for a 1980's estate on the edge of Maidenhead: particularly easy as the residential buildings fall into a small number of categories: bungalows, two-storey-houses & maisonettes (purpose built flats in a house-like structure.
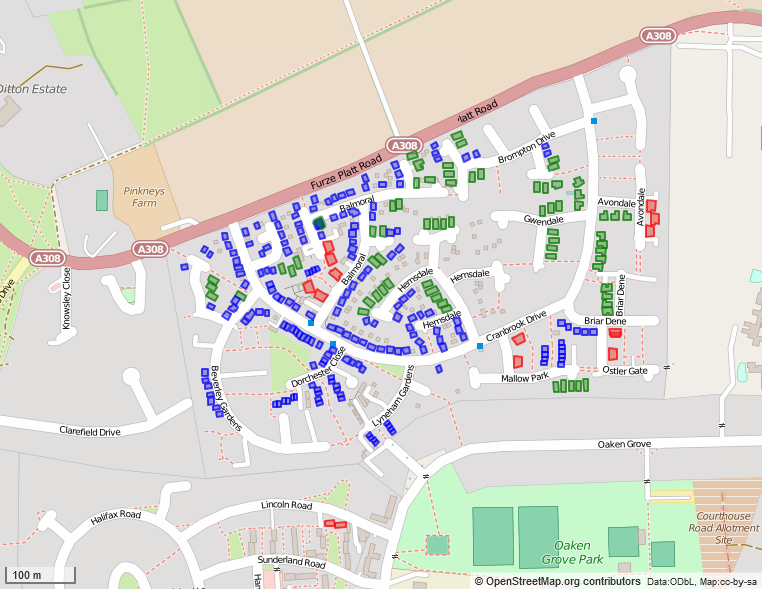 |
| A 1980s housing estate with building heights mapped from English Environment Agency LIDAR
Open Data. Buildings fall into 3 height categories: bungalows (green:
approx 4m high), 2-storey houses of various kinds (blue: approx 6 m
high), and maisonettes (condominiums) which are about 7 m high (red).
Heights were calculated in m, so the values represent minimum heights of
the highest part of the building, which is nearly always the gable line. Outpur via Overpass Turbo, styled with MapCSS. |
What kind of building data should be added to OSM?
From past experience single building outlines traced from OS StreetView, turn out to represent tens of buildings on the ground. Such simplified outlines just makes the work of splitting the buildings properly quite a lot harder. This can be particularly bad in town/city centres.Usually if adding detail of POIs and addresses it is important to have individual buildings mapped: this makes it much easier to correlate photos to roofline features such as chimneys, gables etc. A single very simple outline may be OK, because for more detailed mapping it should just be a question of deleting the original outline. However, the question must be asked, as to what purpose such an outline fulfils on OSM, when the source data can be readily combined with OSM data for downstream consumption.
 |
| Granby Street, Leicester. The multiple buildings shown here are represented in OSM as single buildings for each block (imported from OS StreetView Open Data). CC-BY-SA © Copyright Malc McDonald and licensed for reuse under this Creative Commons Licence. |
If the work involved refining a building outline takes longer than re-drawing the building then I doubt if its worth importing the building at all. This is particularly true if the outline is actually of multiple buildings. This is why large building outlines are most valuable: they are generally pretty good compared with what an initial hand-traced outline might look like, and they lend themselves better to stepwise refinement. One group of buildings I find particularly tedious to do well are schools which tend to be a sprawling mass of interconnected buildings. Starting with a decent polygon with orthogonalised angles make adding such detail much easier. The current quarterly project for UK-based mappers might be the time to test this.
Of course it may be that adding buildings assists in some other mapping goal. I've already mentioned that details of buildings are very useful for addresses. However OpenMap Local lacks the detail in precisely the areas where it would be most useful (city & town centres). For suburban or inner-city housing similar polygons can be created as quickly in OSM editors (notably in JOSM, by duplicating existing buildings or using the Terracer (or even UberTerracer) plugins.
The other thing which many people want is rendered maps largely derived from OSM, but showing more buildings. In practice, because many mappers do not have the know-how, wherewithal or time to create such a rendered view, they tend to want to import buildings. Historically, OSM tools for importing data are often much easier to use than ways to incorporate the same data and OSM data to render maps and make them accessible on the web. Perhaps we need to do more to help people in the latter task: which is now getting more complicated again with the move to vector tiles (at least outwith use of MapBox Studio), and TileMill's effective status of being a legacy application.
Summary
Sadly, although the new building outlines are better than what preceded them, in most cases they don't offer a decent route for iterative refinement with OpenStreetMap.This absence of a simple way to improve building outlines means that ideally people wishing to use this data would merge it with OSM data outside of OSM. I do recognise this is often too much work, or too big a learning curve for many, and consequently there will always be a desire to add buildings to OSM because many people are much more comfortable with consuming only OSM data for their purposes.
Existing tools for drawing buildings in OSM are pretty powerful & getting more powerful all the time. Many of us, and I include myself in this group, are unaware of the full extent of these utilities. See bdiscoe's diary post about mass adjustment of circular buildings (huts) for some insights.
