Monday, 28 February 2011
Frustrated in Oakham
I visit Oakham about twice a year, and on my last couple of visits have done a bit of ad hoc mapping. The town, like the rest of the county of Rutland, was largely mapped many many years ago over one weekend by the Rutland Mapping party. It has received only a little attention since.
When I visit the Rutland Bird Fair I usually travel by bus, so the first thing I ever noticed about Oakham on OSM was that it was missing the road off the main street to the bus terminus. I was eventually able to fix this during the 2009 Bird Fair. I made a few other corrections, but also added an 'e' to Catmos Street, which provoked comment on talk-gb. (In my defence, OSM had Uppingham Road as Catmos Street for 3 years). Last year I added the Tescos car park and a couple of shopping arcades.
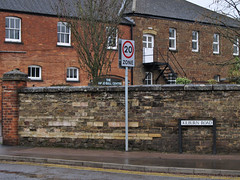
On Wednesday, I thought I'd sneak off and clean-up some mis-matches between OSM data and OS Locator. More or less as soon as we arrived I noted an unrecorded footpath, and then a small residential road opposite the library. This is the problem with Oakham, superficially it looks to be mapped in detail. In practice, there are still plenty of significant features missing. For instance, there are loads of 20 mph speed limits around schools (e.g., on Kilburn Road, Ashwell Road and Braunston Road).
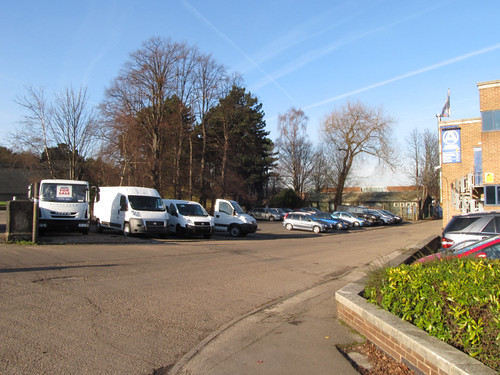
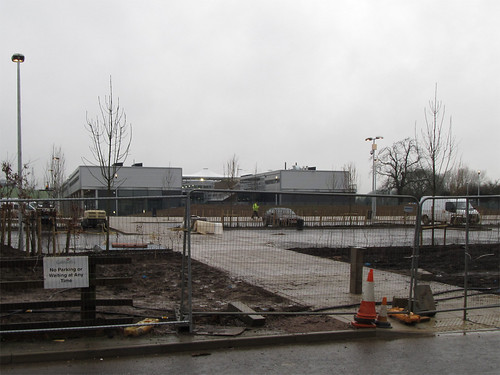
Furthermore, most mapping is now four and a half years old, and Oakham is changing. The most obvious change is a huge construction site on the Barleythorpe Road: the Catmose Campus which will house a sports centre, and new buildings for the main secondary school in the area. I walked past it in the rain (photo below): apparently the school may move in next Monday (a bit optimistic I'd have said). However, if the last couple of years are anything to go by, this dramatic addition won't get mapped in detail for a while.
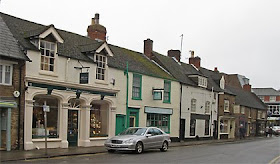
Other changes are impending: Sainsbury's just had a planning application for a supermarket turned down, and Waitrose have one pending. In the summer there was a for sale sign over the Agricultural Showground suggesting that it has been zoned for housing. Even the shops on Mill Street which I've mapped show many changes from the same street a year or two ago as can be seen by looking at Google StreetView.
There are other issues with the mapping: both tagging and mapping practice have changed since 2006. Most GPS data is probably more accurate, and of course we have aerial photos, and OS data as well.
BUT, most of all, what we lack,is someone based locally. Someone aware of what is happening in the community, such as this interestingly acrimonious planning meeting. Someone able to pop down to the library or the study centre in the Rutland County Museum to check old maps or other sources for names; Someone who knows whether the sixth-form college is called "The Rutland College" or "Rutland County College", and , indeed, what's going to happen to it if Waitrose build a supermarket on its current site; Someone who can act as an advocate for OSM with groups like the formidably active local history society. Surely if someone is willing to compile a list of bells, clocks, scratch dials for Rutland, there might be one person interested in something as mainstream as contributing to a map. This is not just true for Oakham and Rutland, but for many places in Great Britain.
Not for the first time I wondered if a mapping party, consisting mainly of visitors, might have the same effect as an import. The town looks nicely mapped on the slippy map, so no-one notices that there's lots to check and correct: indeed if I regularly drove to Oakham I might not have noticed these deficiencies in the first place. I collected data in the rain with these doubts in mind. I'll map what I can, there is far more which needs to be checked, corrected, and enhanced than anyone can collect in a fleeting visit.
Tuesday, 15 February 2011
Updating Pub Density
I was hugely gratified by the interest shown in the pub density map. My original intent was rather more serious than just visualising a class of POI popular with OSMers.
I now have access to the government generated areas used to present census, and other population-based data, in a uniform way. These are called "Super Output Areas", and, I think, roughly contain 7500 people. Unfortunately, I only have these areas for England and Wales (I currently have a request with the General Register Office for Scotland for those North of the border).
So, here is a new pub density map:
A larger version is available on Flickr.
There are lots of things to notice, so I'm just going to highlight a few:
- Outer London has loads of gaps.
- Grimsby seems to be teetotal.
- A whole swathe across the Pennines from Liverpool to Doncaster and beyond is rather pub light. Many parts here have been traced from various sources.
- Wales is still light on pubs, which is to be expected because it is seriously under-mapped.
- Nottingham has three areas without pubs, one probably does not contain any pubs, another is poorly mapped, and the third has been traced.
Government Open Data License FAIL
I'd like to illustrate this post, but it's taken so long to work out whether I'm allowed to I haven't had time left.
I wanted to extend my analysis of various OSM datasets by correcting for population density. A simple and obvious way of doing this is using the Super Output Areas defined by the Office of National Statistics.
Firstly, the data are not available on-line. Last week I completed the rather horrible Word document form available at the ONS site. I was pleased to get the CD promptly in the post yesterday. So far so good, just 5 days delay compared with an online download.
Next, I thought I'd check through the T&Cs: I expected a non-commercial license or restrictions similar to those of Natural England and other bodies which allow you to use their data, but not to show it to anyone else. So here are the main terms:
OK, how do I get a click-through license?
A link in the terms took me to the National Archives site, which mentions two kinds of license: an open government license, which has nice clear terms:
But I've already waited 5 days for the data, and now I've spent a frustrating hour going from pillar to post between sundry websites belonging to different government departments all with slightly inconsistent messages.
If the ONS had published the data online they could have up-to-date license information, rather than old stuff pertaining to when the printed the CD, and I would have known exactly what I could and could not do with the data.
Enough moaning, time to use the data. Oh, there's another file of T&Cs, this time from the Ordnance Survey ...
I wanted to extend my analysis of various OSM datasets by correcting for population density. A simple and obvious way of doing this is using the Super Output Areas defined by the Office of National Statistics.
Firstly, the data are not available on-line. Last week I completed the rather horrible Word document form available at the ONS site. I was pleased to get the CD promptly in the post yesterday. So far so good, just 5 days delay compared with an online download.
Next, I thought I'd check through the T&Cs: I expected a non-commercial license or restrictions similar to those of Natural England and other bodies which allow you to use their data, but not to show it to anyone else. So here are the main terms:
There is no restriction on the use of the material except that:If I want to make an image using the boundaries and show it on this blog, I require a click-through license. In fact even if I printed out an image and tried to photocopy it in a public library I need a click-through license!
• a click-use licence must be obtained for re-use and publication;
• an end-user licence issued under a click-use licence must contain these terms and
conditions;
• copyright and source must be acknowledged[4] on publication;
OK, how do I get a click-through license?
A link in the terms took me to the National Archives site, which mentions two kinds of license: an open government license, which has nice clear terms:
• copy, publish, distribute and transmit the Information;There is also something called the Parliamentary License which does have a link to a click-through license page, this time at OPSI (Office of Public Sector Information). This site does state:
• adapt the Information;
• exploit the Information commercially for example, by combining it with other Information, or by including it in your own product or application.
You must, where you do any of the above:
• acknowledge the source of the Information by including any attribution statement specified by the Information Provider(s) and, where possible, provide a link to this licence;
1. Did you know?Although I'm probably OK under an OGL, it's a bit difficult to be sure, so I thought I'd better register anyway. Finally there is a clear statement:
We have completely changed the way you can use Crown copyright information. In fact you probably don't even need a Click-Use Licence anymore. This is because the information previously made available under the PSI Click-Use Licence is now offered under the Open Government Licence
Yeah!IMPORTANT CHANGES TO LICENSING
Crown copyright Information previously made available under the PSI Click-Use Licence is now offered under the Open Government Licence
But I've already waited 5 days for the data, and now I've spent a frustrating hour going from pillar to post between sundry websites belonging to different government departments all with slightly inconsistent messages.
If the ONS had published the data online they could have up-to-date license information, rather than old stuff pertaining to when the printed the CD, and I would have known exactly what I could and could not do with the data.
Enough moaning, time to use the data. Oh, there's another file of T&Cs, this time from the Ordnance Survey ...
Sunday, 6 February 2011
The Mysterious Case of Kenyon Road
ITO have recently released various enhancements to their OSM Analysis1 tool, and the race is on to get local authority areas above 95% completion.
Not a hope in Nottingham, were we're just shy of the 85% mark. Firstly, many of the missing roads are in un-surveyed areas, and, if possible, I don't want future surveys compromised by 'armchair mapping'. Secondly, the OS data often misses many addresses in modern areas of social housing, usually because they have a name, but no associated residential street. I've noted a few lately along Arnold Road, and also on Haydn Road. So even if we ostensibly are 'road-name complete' many addresses in the city would not be located on OSM.
However, I am very content to add names to areas which have been armchair mapped in the past. Doing so adds value to the existing data, without seriously compromising the need to survey. I do not add additional features missing from such data, unless I have seen them myself. Nor do I correct apparent spelling errors, except when I can check against the original source: these may reflect a real difference between what is on the ground and the OS data. Similarly I do not change geometries.
Using OSM Analysis, and using the not:name=* tagging convention has enabled some 150 roads to be cleared, with around 500 to do. BUT, there's one really close to my local survey patch, which I can't resolve: Kenyon Road (picture above). I know the small stretch of concrete well : as you can see from the photo it mainly provides hard-standing for lorries. Although it will show up as Kenyon Road in all sorts of maps &mdash OS MasterMap, GoogleMaps , BingMaps &mdash there is no evidence on the ground. I presume the road started out providing access to premises sited on an awkward bit of land sandwiched between the Nottingham Canal and the River Leen. Around 1975 the local Scout troop sold a small portion of land to the truck dealer to widen the road, so I don't believe it's a public road. The company's address is 522, Derby Road, so its not used for addresses. Furthermore, the name does not appear on out-of-copyright 25 inch to the mile maps from 1937-1940.
So ever since OS Locator came out I've had a dilemma: is this just a small error creeping in everywhere from erroneous OS data; is it a 'book' name, that is one never used except on official maps; or is it an obscure name known to a small number of locals. There is a glimmer of information in the latest issue of the Lenton Times, where the road is mentioned in an excerpt from the 1957 Kelly's directory. I plan to follow this up and ask the experts at the Lenton Local History Society. In the meantime it remains un-named.
View Larger Map
I mentioned this at WhereCampUK, and someone pointed out that this type of in-depth investigation of a single streetname is something that neither the Ordnance Survey nor commercial providers are every likely to do. It's one reason why OSM has the potential, as Chris Hill put it on IRC the other day,
"not to be the best free map, but the best map".
1. Registration required.
Saturday, 5 February 2011
Turn Restrictions for Great Britain
I continue the quest to find proxies for ground survey mapping.
Today I've looked at turn restrictions, (no left turn, no U-turn, and so on). Mapping this is still considered 'advanced': it involves relations, and until recently there was little editor support.
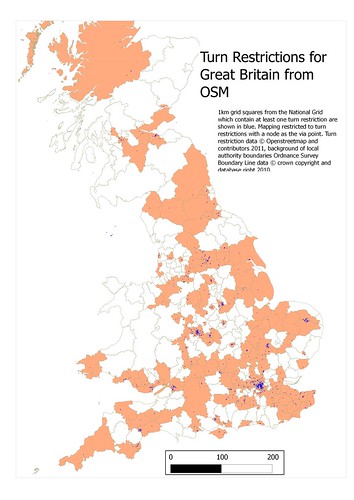
There are only just over 1600 turn restrictions mapped for Great Britain, a small number use ways as the via point (I've done this for No U-turn restrictions), and one uses a relation as the via point. This analysis is restricted (sorry) to the more conventional ones which use a node as the via point. The map shows both local authority areas, with at least one turn restriction, and 1 kilometre squares of the National Grid with at least one turn restriction.
OSM is obviously in the very early stages of adding this sort of information. I would expect most moderate sized towns to have at least one turn restriction (for example, ensuring traffic flow along the main street). I think we can also infer that even dedicated mappers have not yet included turn restrictions in their 'must do' mapping targets.
Wednesday, 2 February 2011
An Exploration of Bad Polygons
I'd hoped to get further with my Urban Atlas simulation, but have been distracted by badly formed polygons. In using osm2pgsql, I relied on it for conversion of OSM data to polygons in PostGIS. The polygons get created and load fine, but once I started clipping sets of data I noticed that I was losing some landuse polygons. Specifically I noticed that the residential landuse for the two large villages (or small towns) of Bingham and Radcliffe-on-Trent were missing. The image above shows the Harlequin area of Radcliffe with residential landcover (red), but the polygon for the rest of the village has gone.
I was not at all sure where the problem lay. I reimported the data with a different version of osm2pgsql; I used an older data set; I even rendered the area using a modified version of the OSM mapnik stylesheet (see image to right with the missing polygons highlighted) . In all cases the Bingham and Radcliffe polygons could be retrieved and displayed in QGIS but disappeared on clipping. They were successfully rendered by mapnik. When I tried to perform the clipping in PostGIS the error messages were much more explicit. A bit of delving in the PostGIS manual led me to the ST_IsValid and ST_IsValidReason functions. Even better a quick search found a nifty function called CleanGeometry (link to code here) which I have now installed in my template OSM database on Postgres. Running this on the landuse polygons got rid of the intersections, so problem solved.
Only partially. It's really much better to find the problem at source and resolve it there. I had tried the JOSM validator on the data but it did not report any problems, so I was still uncertain if it was a hidden bug in osm2pgsql or a data problem.
I left the issue for a couple of days, until, whilst checking some address data, I noticed Geofabrik's OSM Inspector had a set of Geometry validation tools. I'd never found a use for these in the past. Of course, Jochen Topf and Frederik Ramm thought about this sort of problem long ago and I could instantly see the exact location of the problems, and even click on an icon to start-up Potlatch in the right location. Just another illustration of the rich endowment of the OSM ecosystem.
Great Britain has around 1500 badly formed polygons (based on data from Jan 22) or about 0.2% of the total data. Of these about 80% are self-intersecting and the rest are mainly self-intersecting rings. Many are buildings (400 or so, as seen in the screen-shot above), with the rest more or less evenly distributed between landuse, woodland (natural=wood) and water (natural=water). Overall the error rate is extraordinarily low given that most OSM contributors are, like me, probably don't do formal checks on the geometry of their data.
So I can go back to my simulation, having once more found that OSM provides the tools I need.