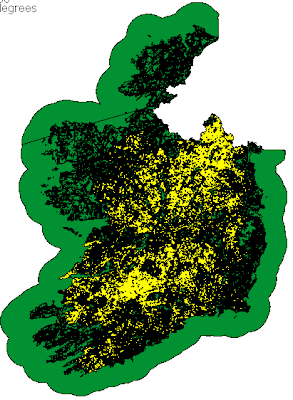
OSM's bard was having problems yesterday with Corine data for Ireland. It turned out that the Corine class 231 (permanent pasture) ran more or less continuously through Ireland from Malin Head to Kinsale Head. This created a single relation with around 17,000 members, the "rogue polygon" (see image). Needless to say required a lot of processing with osm2pgsql for rendering with mapnik. At least it might be accurate rather than the large healthcare facility that Google thinks exists in Letterkenny.
I learnt about the related EEA (European Environment Agency) project called the Urban Atlas. This uses a similar classification of landuse to Corine, but a much smaller minimum size for survey units. The maps produced have a lot of detail and look very interesting. Compared to some other countries the UK has only got coverage of a limited number of cities. But, Nottingham is included. In fact the Nottingham Urban Atlas covers a huge area apparently contiguous with the boundaries of the Districts of Erewash, Broxtowe, Rushcliffe, Ashfield, Mansfield and Gedling, and Nottingham Unitary Authority.
In some parts of Europe, such as Poland, Urban Atlas data is being prepared for import to OSM. Although not interested in the data for import I expected it data to be useful for two reasons in the first instance: completeness of coverage, and as a control for OSM tagging. The Corine division of urban fabric (roughly equivalent to OSM landuse=residential) makes useful distinctions with regards to density and continuity of urban areas, which, to date, are under represented in OSM. This type of distinction has a long history in landuse mapping. In earlier days it was concerned with urban areas which could be productive for fruit and vegetables. Nowadays, water run-off and nature conservation issues are probably more significant. As a mapper one is always aware of the difference, but I, for one, don't try and capture it explicitly. The Urban Atlas methodology has criteria which it should not be too hard to adapt for OSM, but we do need to think about appropriate tagging.
Of course the first area I looked at in the Nottingham Urban Atlas data was the two slices I've mapped this year. Part of the point of combining survey and Bing data is to capture quantitative information about landuse. So here is the area from the Urban Atlas, using the standard colour scheme:

The first thing which strikes me is that the Edwards Lane Estate is not given a uniform classification. This seems very odd: the estate is clearly a single uniform design including road widths, garden sizes, house types. I assume that it was planned with a specific population density in mind, and specific guidelines in terms of percentage of the area devoted to houses, gardens, open space and road infrastructure. Here's the same data with houses I've recently mapped in OSM : it's very clear that areas with identical numbers of identical houses have been assigned to different categories:

So note the darker red areas with code 11210 : on the ground this is indistinguishable from the rest of the estate (coded 11220) . All I can conclude is that the data were not subjected to ground validation: an overview of the methodology is shown in this presentation. Detailed inspection of other well-mapped areas reveals similar minor anomalies: industrial and commercial areas spilling over to residential blocks; areas in campuses (colleges, hospitals and universities) being incorrectly assigned to residential categories; and soon and so forth. These nuances probably don't affect the reliability of the data for its purpose, but they do reflect how the data was sourced. One issue might be how parcel boundaries are selected, which may have the effect of putting all of some shared resource in one parcel (such as a kids' playground). I'd hoped to find time to measure housing density based on OSM data for the shapes shown above, and thus have more confirmation. It will have to wait for another time.
The bottom line: this sort of data set can be created as a side effect of areas which have already been mapped in OSM. A small amount of additional tagging is needed on residential areas, but otherwise a comparable dataset can already be produced for much of the Nottingham area. The EEA should start considering OSM as a primary source for any extensions of this dataset in places like Germany and many parts of the UK. OSM data is likely to be more accurate, reflect better understanding of the locale, and be more up-to-date.
Postscript. I find it slightly boggling that I'm disparaging a data set which two years ago I would have thought was fantastic. It's great to find how powerful OSM is becoming.
No comments:
Post a Comment
Sorry, as Google seem unable to filter obvious spam I now have to moderate comments. Please be patient.