 |
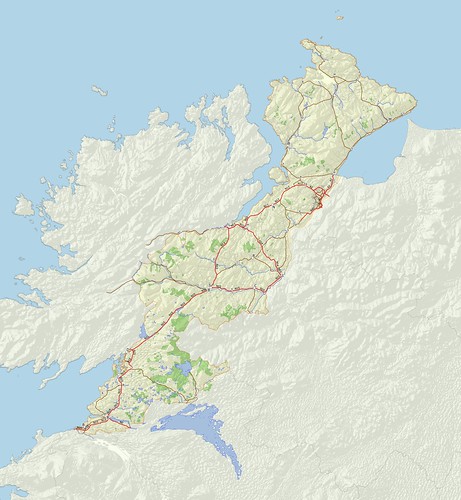
| H34 West Donegal: Vice County raster map suitable for MapMate Source data: (c) OpenStreetMap contributors; hill shading NASA SRTM via viewfinderpanoramas.com |
One of the things I'd always planned to do once I had a half decent data set for the Irish Vice Counties was to create detailed raster maps for each of them. This is mainly because I've found using such raster maps useful for my own biological recording using MapMate software. They make choosing the correct recording location much easier, and reduce the hassle in producing more attractive (and communicative) outputs. I've detailed the principles behind the creation of such maps here in the past.
With the first such map I produced I struggled to get it to align properly with the Irish Grid displayed with MapMate. I could upload MapInfo .MIF files which would align, but these offered nothing like the degree of detail I want to show. Furthermore the import process with my copy of MapMate only seems to work with polygons. I tried a variety of ways: mainly trying to tweak the .TAB file format which I'd used successfully with files for Great Britain.So I put the idea to one side.
Very recently, prompted by Julia Nunn, VC recorder for County Down, I re-looked at the problem. Once again I was getting nowhere and I was on the verge of seeking expert help from Richard Cantwell on the arcana of MapInfo's formats, many of which date back to the 1980s. (Richard works professionally with MapInfo data a lot and has written some very informative articles available from his firm's website.)
Note. Much of this post will mainly be of interest to users of MapMate. However, towards the end I digress into geonerd territory when discussing the pros and cons of MapMate's technical choices about projections. Also please note that has been sitting in my draft folder for a while before being published.
I soon realised that there was another approach I had not tried.
MapMate allows one to 'calibrate' a raster image by clicking on two locations and entering the grid co-ordinates. I have always found this a bit chancy and tedious to set up, and even then one is still often a pixel or two out. Even with this approach I was failing: I could get a raster map registered but it would be to the British not Irish Gird. Whilst doing this I finally remembered that MapMate will save a given map as a bitmap with an associated calibration file. This finally gave me proper insight as to how to crack the problem.
What I did was create a map of County Down in MapMate using its own internal data, and then saved this as a calibrated bit map. The calibration files are rather simple:
<mapmate>
<cal>
<name>test.jpg</name>
<timestamp><timestamp>
<copyright></copyright>
<units>m</units>
<datum>WGS84-modified</datum>
<projection>Local</projection>
<coodtype>EN</coodtype>
<rotation>0</rotation>
<type>raster</type>
<xo>-160000</xo>
<yo>200000</yo>
<xi>-50000</xi>
<yi>290000</yi>
<xpixels>4400</xpixels>
<ypixels>3600</ypixels>
</cal>
</mapmate>
The key parameters being the bottom right and top left in MapMate's internal co-ordinate system, and the size of the raster file in pixels. To make life easier for myself I took the initial MapMate map and used the option to re-frame the map to the 10km grid. I could then write down both the grid co-ordinates and the internal MapMate co-ordinates for the map bounds. I did this for all Irish Vice Counties (although MapMate wouldn't snap to the grid for a couple, and its bounds for Fermanagh
were broken), and recorded all the values in a spreadsheet.
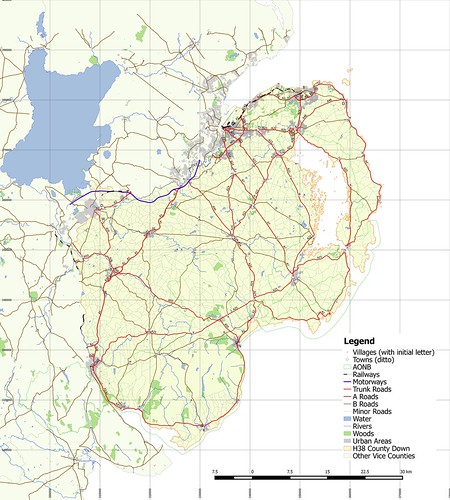 |
| First MapMate test picture map for County Down Data: (c) OpenStreetMap contributors |
Hillshading
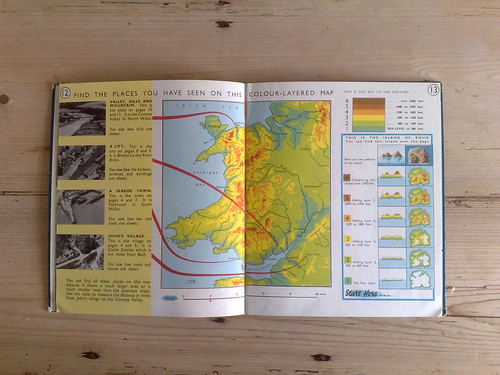 |
| Collins Progressive Atlas page 12 : my introduction to hill-shading, contours & hypsometric tints. I was about 6 years & 4 months of age. |
Another motivation for doing this lies way back in my childhood. I was given a book at Christmas when I was six called Collins Progressive Atlas. I still have it, and flipping through its pages I'm amazed at its ambition in teaching map reading & many of the principles of cartography to young children. The image above shows on a 2-page spread it introduces some rather sophisticated concepts. (An aside: I'd love a way to do something like the 3 opening page spreads for anywhere in the world. OSM is a perfect starting point).
To do this I downloaded raster DEM files from ViewFinder Panormas, and processed them in QGIS to produce hill-shading, contours and tints. I did so pretty much using the standard defaults : these can be improved upon as can be seen from the work of folk like Andy Allan (Thunderforest) and Richard Fairhurst (cycle.travel).
Having done this I worked through all 40 of the Vice Counties: the images are currently available on Flickr, but I have
MapMate's Co-ordinate system
The last thing I wanted to do was understand MapMate's internal co-ordinate system.To do this I created two geolocated images which were 100 km square (basically the Irish Grid Square C and the British Grid Square composed of half each of NW & NR I made sure I had both grids visualised in the images. I then created MapInfo calibration files based either on bottom-left (corresponding to Irish Grid) or top-right co-ordinates (assumed British Grid).
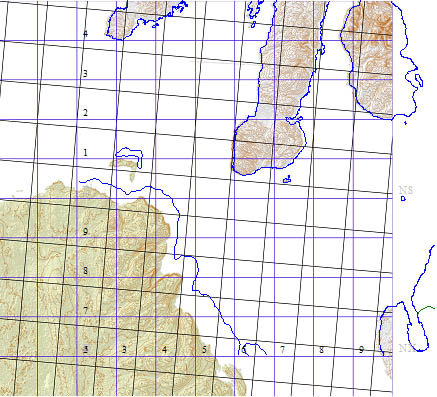 |
| Using QGIS I created raster images with both Irish (grey-brown) and British (blue) grids. |
 |
| 100 km sq. British Grid (from NW05 to NR49) |
 |
| 100km Irish Grid sqaure C. British Gird in blue. |
MapMate internally uses an Access database without any geospatial features. It also only allows its notional recording units to be grid squares (AFAIK, of any size from 1m to 10km), which helps because most geospatial calculations can be done using simple arithmetic. It does recognise that any particular grid square is within one of its internal polygons (local authority & vice county boundaries). As it does this quickly there may be a bit more to the code than just sums.
The decision to rely on the useful properties of a regular kilometric grid, and effectively hard-wiring two grids into the code, has an unfortunate consequence for MapMate. It is not a practical tool for biological recording outside the British Isles (although I think at one stage it was adapted for Luxembourg). Whilst the Dutch & Swiss use 10km grids for recording, most other countries with well-established recording systems use some variant of a latlon grid: in Germany sheetlines of 1:25k maps are used in Baden-Württemberg, elsewhere it's often a 7.5 or 15 minute 'square'. (MapMate also suffers from being based on old technology, but that is another (huge set of) issue(s)).
Coda
MapMate is still a phenomenally useful piece of software, widely appreciated by its users as being straightforward to use, but it increasingly suffers from both being based on very old software, and a business model which does not provide enough recompense for continued development.At the same time the newer approaches of web-based and app based data entry do not yet deliver all the same functionality. I've tried address one deficiency of MapMate with more accurate maps delivered as images. However it cannot fix how MapMate internally validates records based on boundaries. I do believe that this and similar approaches can be used to maintain or extend MapMate's utility until newer software reaches a similar level of functionality.
No comments:
Post a Comment
Sorry, as Google seem unable to filter obvious spam I now have to moderate comments. Please be patient.