 | |
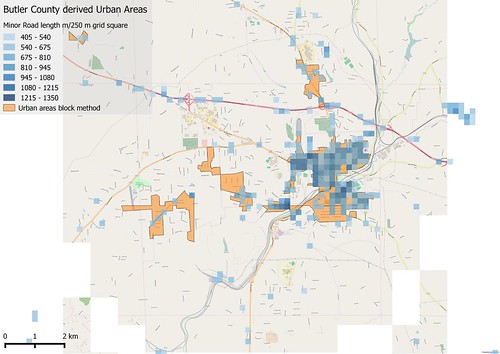
| Comparison of Urban Areas derived using "block method" and gridded road density. Only grid squares with over 500 m of road included. The area shown is around Butler, Butler Co, PA |
Showing posts with label Butler County. Show all posts
Showing posts with label Butler County. Show all posts
Sunday, 15 November 2015
Urban Areas 4 : Derivation from OpenStreetMap using road density
Another variation on the theme from the last post: this time looking for some measure of road density.
The easiest way is to sum road lengths in individual cells. The cells have to be quite small (say 250 metre square) to achieve the resolution desired. I've excluded link roads and motorway & trunk highway classed in this calculation.
Saturday, 14 November 2015
Urban Areas 3 : derivation from OSM using residential blocks
 |
| View S from the Cathedral of Learning in Oakland, Pittsburgh, showing some urban areas used as tests in this post.
The incised valley of the Monogahela in the background contained railways and steel works. The plateau beyond has residential suburbs of Pittsburgh. To the left foreground are the woods and ravines of Schenley Park, with a residential area beyond. Source: Zack Weinberg via Wikimedia Commons CC-BY-SA
|
One of the obvious features of the highway network for the USA on OpenStreetMap is that road density is much higher in built-up areas. I started looking at how to measure this, when I recalled a method for identifying city blocks introduced to me by a Brazilian user of OpenStreetMap data.
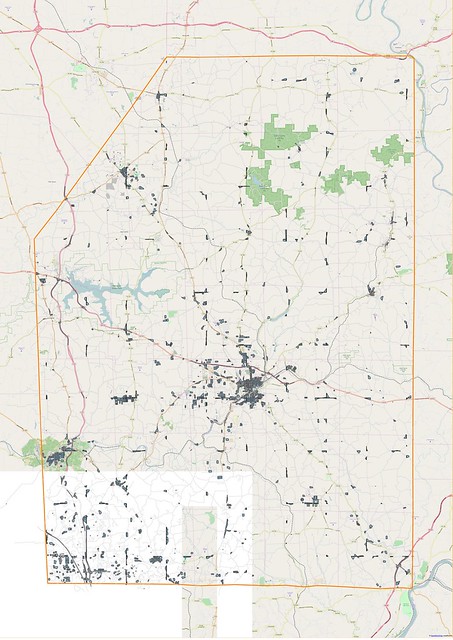 |
| Residential Areas for Butler Co, Pennsylvania, identified with the block method from OpenStreetMap data. Orange line outlines Butler County. |
The method itself is also really quite simple:
- Take the main road network for some area and make a union of it (which will be a MULTILINESTRING).
- Polygonize this data, and decompose to individual polygons.
Subscribe to:
Posts (Atom)