Showing posts with label landuse. Show all posts

Friday, 28 June 2013

The Shopping News: mapping retail outlets in Nottingham

Nottingham Open Data 6
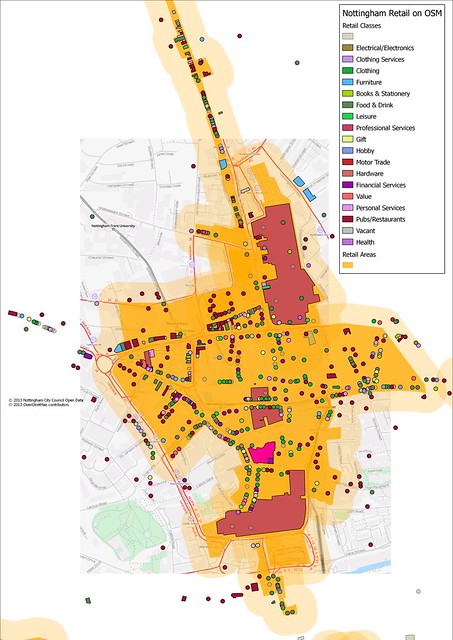

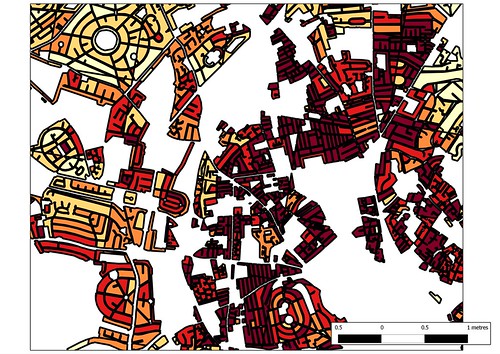
ng_retail__detail20130613
Nottingham City Centre retail areas with mapped retail units
(shops, banks, pubs, restaurants, cafes, fast food outlets etc.;
the large areas are shop=mall (an unsatisfactory tag)).

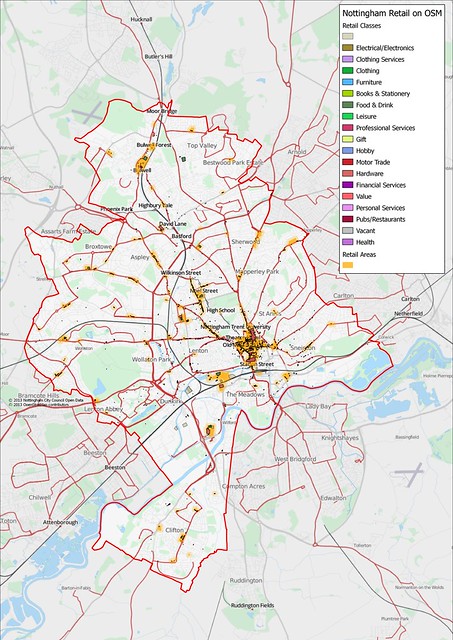
ng_retail_20130613
Retail landuse and retail outlets in the city of Nottingham
(a buffer is used to accentuate smaller retail outlets)

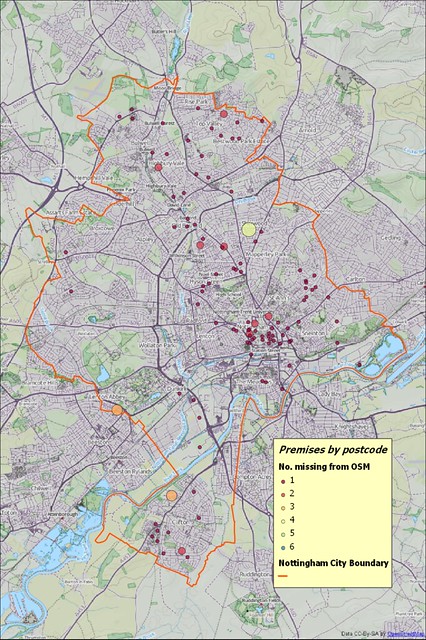
This morning I achieved one of my targets for using Nottingham Open Data. This was 90% reconciliation of the Licensed Premises dataset (this compares with around 40% when I first blogged about it).

Tabulation of reconciliation of Nottingham Open Data Licensed Premises File vs OSM
(loaded as an image because turning my Excel stuff into an HTML table is a PITA).
It seems like a good time to take stock (pun intended) of my retail mapping within the city of Nottingham.

ncc_miss_lic_pcs_20130628
Licensed premises from Nottingham Open Data not reconciled to OpenStreetMap
(plotted as number of premises at postcode centroid) cf. with original map.
I started doing this when my mother asked me to take her to church and I realised that I could do a short productive mapping session whilst she was at the service. For the following 2-3 Sundays I mopped up as much as I could in the area close to her Church. Then at the end of April I got serious and instead of doing my shopping locally I drove to other groups of shops when I had an errand. In this way I've visited the majority of local shopping areas (with two major gaps: Mansfield and Carlton Roads).

Most mapping sessions have been just over an hour in length, mainly involve photo mapping and seem to generate a huge amount of data. With a small number of exceptions in the City Centre I haven't done repeat surveys. Apart from trying to take lots of photos I have not tried to map everything I came across, which has been my usual approach in the past. I started doing this on my first outing, and took 30 minutes before I mapped my first shop, and had only 10 minutes for other shops, so I was going to take forever doing it my old way. So I stopped worrying about grabbing everything and just tried to get shops, but did collect other information if it was convenient and readily accessible.

I distinguish between these two styles of mapping, by analogy with farming, as intensive and extensive. In one we put all our efforts into maximising yield (of crop, or OSM data) from a small number of hectares; in the other we are happy if the yield is good enough.

What I've done.

  • Added postcodes to as many as 5,000 objects. (It's a little difficult to check as I have touched objects which already had postcodes).
  • Added around 1,200 different postcodes, about 20% of the city. (Again some may have already been present.)
  • Added around 5,800 housenumbers. These are not just retail premises, but houses close to shopping areas, and when I've walked along streets I've tried to add house numbers at intersecting streets.
  • Added over 2,500 buildings.
  • Taken 7,000 photos. Of which around 6000 are now available on OpenStreetView.
  • Recorded about 13 hours of mapping audio.
  • Loaded around 200 kilometers of GPX tracks.
What I've still to do.
  • Finish adding POIs for shops (particularly in the City Centre).
  • Indoor mapping in the two main Shopping Centres (Malls) in the middle of the city.
  • Finish adding building outlines in the retail landuse polygons (I'm tending to do smaller ones first)

Things I've learnt (and why)

  • Map all shops in a group together. If a single shop changes use or closes and the row of shops has been mapped it is often impossible to reconcile which shop has been affected. It's far better to be systematic for a small area than mapping patchily. Exceptions can be made for very recognisable buildings or POIs. (This also helps check that POIs are in the correct location, see below).
  • Open Data Addresses are great. The Open Data is not accurately geo-located (only to postcode), but it does contain the address. This meant that as long as I could locate the business on Bing aerials I did not need to collect detailed address data. This made surveying less arduous. 
  • Good high-quality building outlines help. A single building outline covering a whole block is useless. A lot of Nottingham City Centre had building polygons mapped not from aerial photography but from OSGB StreetView. Firstly the building outlines were not very accurate. Secondly, it is very time consuming to divide and correct such amorphous polygons.
  • Good photos and; decent aerial photos are critical. I have taken a huge number of photos (all available on OpenStreetView) to assist this mapping. I try and get photos of the roof line as I can correlate chimneys, dormer windows and other roof-line features between the aerial photos and my street level ones. It is amazingly easy to displace a POI a few tens of metres even with all this information.
  • Android Apps aren't much use in a City Centre. I made some use of KeyPadMapper3, but found the data often needed to be tweaked because my android phone GPS location wasn't too good. In the City Centre the canyon effect even with a Garmin is too much. A further reason not to use the phone is that I was already using a camera, two GPS (one in the backpack) and a digital voice recorder, juggling these and the phone was too much. The phone did come into it's own when the batteries ran out on the dictaphone. In the end I used the voice recorder for most addresses I collected. I didn't try Vespucci.
  • History of POIs is enormously helpful. Most of the errors in the Open Data are failures to update historical data (POIs closing, changing ownership, re-branding, or moving elsewhere). In many cases Nottingham mappers have kept the historical information when updating POIs, and this means that it's mush easier to reconcile OSM with the Local Open Data.
  • It's really difficult to tell if some POIs are still open. See the associated post on Vanishing Pubs.
  • Night-time surveying is the only way to check the status of some Bars, Nightclubs and Fast Food outlets. I'm too old to be a night owl, so someone else needs to do this.
  • POIs change fast. (Well I already knew this) My re-surveying of Market Street, Mansfield Road and Upper Parliament Street/Forman Street, which were all done 2 years ago by Paul Williams enables the rate of change to be quantified.
  • A 5% error rate in local government open data seems a reasonable assumption. This is not too different from rates found with NaPTAN and Ordnance Suryey Open Data Locator. It does mean that it's far better to use this data as the basis for survey (as we have done with Locator) rather than import (as was done with NaPTAN).
  • Local Government Open Data needs significant interpretation. It is collected for discrete purposes, and there is no integration across data sets. I presume licences are granted for a number of years. Therefore there are no checks as to whether the licence is still in use, or even has ever been used, until renewal time.
  • Extensive surveying is more fun, and less exhausting, than intensive surveying. By an intensive survey I mean one intended to collect all types of mapping data in a discrete area. Extensive surveying involves covering a larger area perhaps with some specific targets, but most information is collected as a side product rather than with deliberation.
  • It was a good mapping project. A targeted set of POIs makes for a reasonable mapping project over a shortish term.
  • More Systematic Coverage. Extensive surveying means more systematic coverage of the city: even if not in great detail.

What to do next

The next steps are fairly obvious. 

  • Repeat for Food Hygiene Data. I have an additional data source from the City Council which covers POIs which serve food (anything from fast food outlets to schools and hospitals). This is about twice the size of the Licensed Premises file (2400+ cf. 1200 POIs) and at the moment I have only reconciled 70% of the data. In the main this means checking more day nurseries, care homes and similar establishments.  

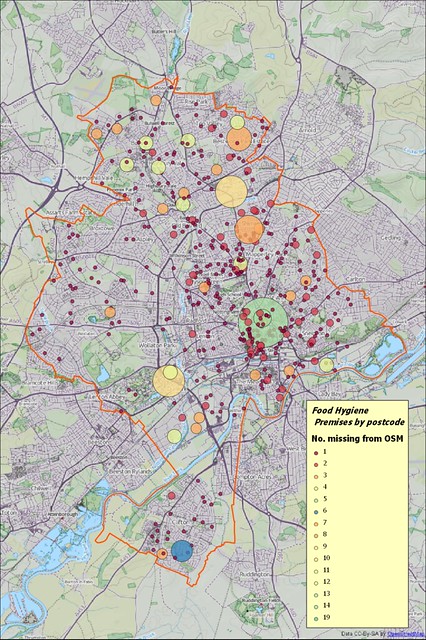
  • ncc_miss_fhrs_20130628
    Premises from Nottingham Open Data Food Hygiene file
    not reconciled with OpenStreetMap (cf. with image above).


  • Change Detection. Build a mechanism for automatically detecting change in the source data. So far I have just used a snapshot of the data, but it would be very useful to find changes in the source data files and use them to drive surveys.

  • Create additional tools for Food Hygiene data. The Food Hygiene data is actually available for many parts of the UK and is Open Data. There are at least 350,000 POIs available. It is usually safe to assume that it is accurate at the postcode level, but in the nature of retail outlets several are usual present in each postcode. It would be nice to be able to create layers for mapping (e.g., in JOSM, Potlatch etc) which spread the FHRS POIs out around their postcode location preferably ordered by housenumber in the right direction. It would also be good to be able to load subsets of this data as POIs or similar into Garmin or Android devices.

  • Developing sensible categories for retail. In some of the images in this blog post I have used an ad hoc categorisation of available amenity=* and shop=* values. It would be useful to develop a more considered version of these categories.
Conclusion

The most important thing is that this project would never have started without the availability of Local Government Data. Although I could have tried to find and map retail outlets I would have missed many isolated ones, and would have had no idea how many more there were to find.

With retail data mapped systematically it becomes possible to evaluate exactly how we use tags and if there are any obvious improvements. Remember that Nottingham is the 8th largest retail centre in the United Kingdom and is therefore a reasonable exemplar for all but the largest retail centres in Europe and North America.

A consequence of trying to be systematic is that I have visited areas of the city which have had very little on-the-ground mapping. I have been able to collect other POIs, addresses, correct road alignments etc.

Lastly, this is a very productive and rewarding means of mapping. If you have any local open data on shops I recommend a bit of Retail Therapy.
Wednesday, 24 April 2013

Segmentation of Retail Landuse: why do Germans only map shops?

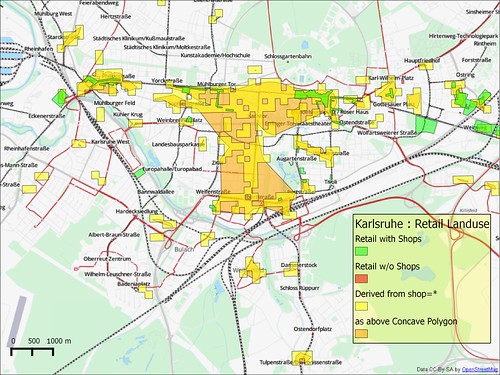
de_retail_karlsruhe
Retail Landuse in Karlsruhe on OSM (scale 1:50k) :
both explicitly mapped and derived landuse polygons are shown, see below for methods.
The availability of lots of open data on various kinds of retail outlets has led to me doing a lot of maps of shops, restaurants, fast-food outlets and bars lately. I'm following in the steps of Paul the Archivist who mapped the Mansfield Road area close to pub meetings we had in 2011. I've got a nice workflow : I map my target area for an hour on Sunday morning, usually trying to get all retail establishments in a quite small area. I also try and collect as many house numbers as I can. I discovered my new mapping protocol, because my mother asked me to drive her to church a few weeks ago and I found it very productive. It also means I've been actively surveying in a neglected inner-city area.


Sunday, 20 January 2013

Schneeberg : Vienna's Mountain backyard

Before SOTM-EU 2011 I wanted to spend a bit of time in the Alps. This is a belated account of that trip.

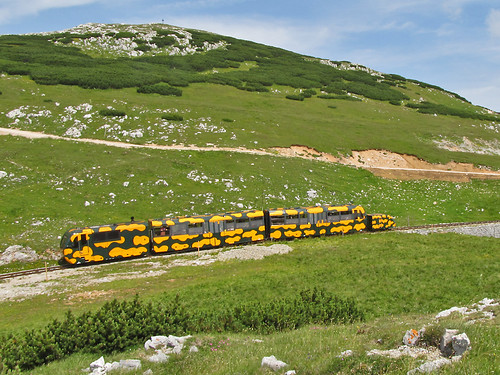
Salamanderzug
Salamanderzug near the top station.

It's been a few years since I've been anywhere in the Alps in Summer, and in the meantime I've improved my botanical knowledge enormously. So high on my list of things to do was to look at alpine flowers properly for the first time. This is pretty much incompatible with serious hiking: botanising takes time, it's eminently possible to travel at about 100 metres/hour.

I therefore wanted somewhere close to Vienna with mountains high enough to have an alpine flora still in flower, and some kind of mechanical uplift. The obvious choice was the Wiener Hausgebirge, groups of limestone peaks reaching over 2000 m about 50 km SW of Vienna I've known about this area for a number of years: when my brother lived in the Viennese suburb of Meidling, I went skiing on a local hill, the Zauberberg at Semmering. At that time I noted the peaks of the Rax-Schneeberg area from the wonderful switchback railway over the Semmering pass.

The village of Puchberg-am-Schneeberg is still a popular day-trip destination from Vienna, but in the past was a small spa resort. There's one large hotel and a smattering of smaller places. I stayed in the Bruckerhof which turned out to be a nice place in a good location at a great price. It is only a couple of hundred metres from the station, and set back from the main road.

Puchberg was pretty quiet in the evening. I had the impression most visitors were, like the guests in my hotel, of a certain age. I was troubled that I'd have difficulty finding a place to eat, as most people seemed to have dined by half-past six. However, the Schwarzer Adler not only did food, put had a proper pub-like atmosphere down to guys playing cards at the Stammtisch.

With an altitude range of around 1500 metres from the village at just under 600 m to the summit of the Klosterwappen on the Schneeberg at 2076m there was a huge range of interesting habitats to explore. The only downside was that most of the lowland hay meadows had just been cut: so I missed out on some obvious places to botanise. On my first afternoon I wandered (very slowly) up the zigzag track through pine woods to the little peak of the Himberg.
Edelweiss
Edelweiss (Leopondtidum nivale)
The following morning I caught the Salamanderzug up the mountain. Even from the train there were special (and protected) flowers to be seen: Martagon Lily Lilium martagon (Türkenbund),   Nottingham Catchfly Silene nutans (Nickendes Leimkraut), and Carthusian Pink Dianthus carthusianorum (Kartäusernelke). On the plateau the highlight was Edelweiss (Leontopondtium nivale) and masses of Mountain Avens Dryas octopetala (Silberwurzen). The latter gives its names to stages of the post-glacial Quaternary, so it's more than a pretty flower.

What has this to do with maps? Well the whole area around Puchberg and the Schneeberg itself are great exemplars of the sort of habitats (strictly biotopes) of the kind I would like to map.

Walking up the path to Himberg, I started in woodland dominated by Austrian Pine (Pinus nigra ssp., Schwarzkiefer), but on the northern side of the hill, this graded in Spruce Picea alba woodland (Tannenwald). Further along there were areas of Beech woodland (Buchenwälder). These are very noticeable: the pine wood has much more light than the spruce wood, and very different plants in the under-storey. Beech woods are different again. The plateau of the Schneeberg was a mosaic of grazed areas with a wide range of herbs and sub-shrubs (Mountain Willows, Mountain Avens, Dryas octopetala; Rose), and extensive areas of Pinus mugo scrub. These can be seen behind the train in the picture at the head of this entry. On the steeper sides of the Schneeberg, flushed areas within the Pinus mugo scrub had different plants again, such as Water Avens and . These were frequented by Fritillary butterflies. The scrub grades into forest, but at around 1000 metres there were many hay meadows, again with a different flora: it was around that I saw Martagon Lily.

The Schneeberg is also an important water catchment area for Vienna. There are a number of limestone sink holes in the summit area from which the general public is excluded to avoid polluting the supply. Again this is a feature which is still difficult to map in OSM.


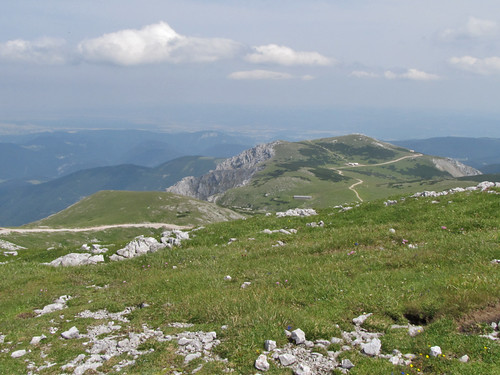
View across Ochsenboden
From near Klosterwappen looking across Ochsenboden

The official map made by BEV doesn't do a bad job of showing some of this information, despite really being a 1:50k topomap. It has a lot of toponymic detail, maps the Pinus mugo scrub, shows a lot of detail of the NE-face. It doesn't attempt to separate out the different forest biotopes: this is something I think is an eminently practical thing to do in OSM. The Schneeberg area is a great place to start.

Another aspect of the Schneeberg is that the NE face offers fantastic opportunities for spring skiing. I discussed this briefly with Felix Hartmann (extremecarver) after SotM-EU, who knows this area well. These are extremely well known, but not mapped on OSM. We don't have a sensible way to map this kind of ski route, nor for labelling features such as chutes, couloirs and gullies.


Notes

GPX traces : http://www.openstreetmap.org/user/SK53/traces/1062809http://www.openstreetmap.org/user/SK53/traces/1062810

List of plants seen: Pinus mugo, Pinus nigra, Picea abies (Fichte, Norway Spruce), Fraxinus excelsior Ash, Salix fragilis (Crack Willow)5, Beech, Pedunculate Oak, Purging Buckthorn, European Spindle, Viburnum latana (Wayfaring Tree)10, (Wild Marjoram), Adenostyles alliariae (), Leontopontidon niavle (Edelweiss), Dwarf Saussurea, Brown Knapweed)15, Perennial Cornflower, Hemp Agrimony, Bath Asparagus, Allium (), Alpine Bistort)20, Alpine Sowthistle, Large-leaved Lime, Yellow Melancholy Thistle, Hogweed)25, Wall Germander, Mountain Germander, Betony, Cyclamen purpurescens (Sowbread), Ranunculus platanifolius ()30, (Globeflower), (Water Avens), Dryas octopetala (Mountain Avens), (Alpine Avens), (Himalayan Balsam)35, (Small Balsam), Meadowsweet, Nottingham Catchfly, Alpine Pink, Alpine Catchfly)40, Kidney Vetch, Alchemilla sp., Martagon Lily, Bladder Campion, Large Yellow Foxglove)45, Wolfsbane, Great Marsh Thistle, Wild Pear, Hawthorn, Milk Vetch)50, Common Rockrose, False White Helleborine, Mountain Sanicle, Sickle Hare's Ear, androsace sp. ()55, Viper's Bugloss, Alpine Forget-me-not, Jupiter's Distaff, Dark Mullein, Eyebright)60, Lousewort, Deadly Nightshade, Rampion, Bellflower, Bellflower)65, Leopardsbane, Woolly Thistle, Jurinea, Golden Hawksbeard, Orchid 1)70, Orchid 2, Orchid 3, Bearded Bellflower, Large Self-Heal74, Inula spp. ()75 , Dogwood, Acer pseudoplatanus (Sycamore, Bergahorn), (Cowwheat), Vincetoxicum hirundinaria (Vincetoxicum, Schwalbenwurz), (Columbine)80, Sorbus sp. (), Elder, Greater Celandine, Horse Chestnut, Goat Willow, Wormwood, Sainfoin, Arctium tomentosum, Nettle, Blackthorn, Hornbeam, Black Bryony, Lady's Bedstraw, Greater Plantain 

More photoshttp://www.flickr.com/photos/mausboam/6013969441/

Monday, 8 August 2011

Augmenting Residential Landuse : building density

Building Density on Residential polygons, Nottingham

Andy Allan (gravitystorm) asked a very pertinent question after my talk at SotMEU: Why had I not used building outlines to automatically identify different classes of residential landuse?

Briefly, my answer was: "I had tried, but the results weren't satisfactory". This is a much longer answer than I could give at Vienna, and fills in some detail about the technical approach I used. I hope that readers may have some good suggestions to improve this approach.

It is clear that Urban Atlas data is a good model for studying landuse mapping through replication/simulation in OSM. After working with this data for six months I realise that one of the main reasons for this is that UA's main classification is simpler than the current OSM consensus for landuse mapping. Thus most UA landuse classes have a 1:M mapping to OSM tags. Other landuse and landcover schemes, such as CORINE, EUNIS, have many more classes and in thus in many cases the classes have N:1 or N:M mappings to OSM tags. Most of these relate to agriculture, woodland or natural vegetation: for the most part where OSM tag usage is only fitfully consistent, or the same tag has multiple meanings.

There are, however, 5 UA classes (Continuous and Discontinuous Urban Cover — 11100, 11210,11220, 11230 and 11240) which map on to a single tag in OSM : landuse=residential. The main criterion for separating this classes in UA is the degree of surface sealing, with continuous urban cover meaning that over 80% of the land surface is effectively sealed (buildings, asphalt, concrete etc.). As a significant proportion of surface sealing will be buildings it seems plausible to use the proportion of residential landuse covered by buildings as a proxy for surface sealing.

Buildings from OSM & OS OpenData
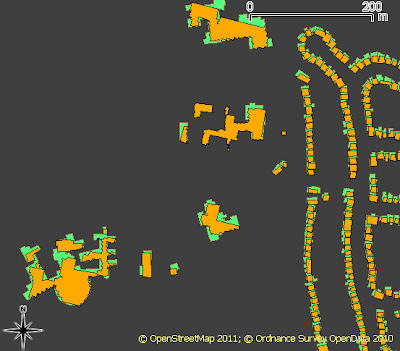
Buildings generated from OS OpenData using mapseg (orange) compared with those mapped in OSM using Bing imagery (light green) for OS grid square SK5038.

Firstly, I needed a decent source for building outlines. My test data area, Nottingham, does have a large number of mapped buildings (47000+), but is nothing like complete. Partially mapped building sets are no use at all for this purpose. I therefore made use of Mapseg a set of python routines written by Tim Sheeman-Chase to extract building outlines from the Ordnance Survey OpenData StreetView (OSSV) tiles. I had originally created this data to make address mapping easier, but was dis-satisfied with artefacts (spiky buildings, failed orthogonalisation, etc.) so I had only used a tiny proportion of the data directly in OSM. My original data set covered the whole of the county of Nottingham and adjacent areas and included over 600000 building outlines: processing and manipulating this was somewhat tedious as each OSSV tile or sub-tile generated a single OSM XML file and I therefore had around 200 files with duplicate node and way identifiers. In the end I loaded each file into PostGIS and merged the data there. I then clipped it to the bounds of the target test area to end up with a data set of 189, 420 buildings. Some geometries needed to be cleaned to remove self-intersections.

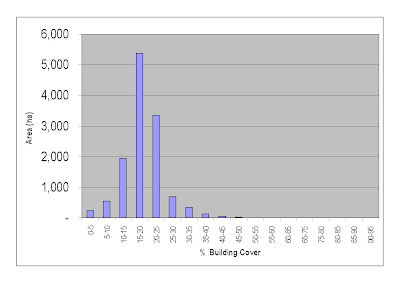
Buildings were then clipped to match the residential landuse parcels, and then assigned to individual parcels. Landuse parcels which had originally been created as multipolygons on a 1 km grid were decomposed to individual polygons (using ST_DUMP) before this step. Polygons meeting on grid boundaries were not re-assembled. At this point it is simple to sum the building area for each polygon and determine the ratio of the total polygon area covered by buildings. The results are graphed below with the data divided into 20 buckets.

For comparison here is the relative distribution of the EEA UA data for the Nottingham area:

UA Code Area (ha) % Total Residential
11100 137 1.0%
11210 7132 52.0%
11220 5298 38.7%
11230 846 6.2%
11240 18 0.1%
11300 272 2.0%

The vast majority of residential landuse falls in two classes with surface sealing in the range 30 to 80%, with more than half of the landuse with greater than 50% surface sealing. A cursory comparison between the two sets of figures suggests that, at best building cover may only account for half factors used to assign surface sealing in Urban Atlas. Fortunately because I created a datasets of differences and similarities of data from UA and OSM it's possible to compare individual landuse polygons: a bit more work as these may be slightly different shapes, and therefore the whole clipping of buildings and area calculation must be repeated.

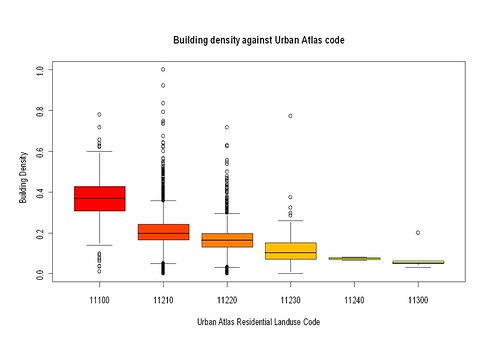
Comparison of UA Codes with OSM building density

The box-plot above amply confirms the initial impression. No doubt if and when I learn more about R, a proper statistical comparison could be done. Building density from OSM does not explain enough of the UA surface sealing value to be reliable for classification. At least for now. There is enough in the plot to hint that enrichment of the data with other variables may facilitate separation, but that's a different project again.

So that's the (very) long answer to Andy's question.

What does it mean for OSM:
  • Using buildings to derive sub-classes of residential landuse is not generally useful.
  • The requirement for completeness in building outlines on its own means that such an approach would at the best of times only work in certain places (good external sources of building data, excellent imagery). It may also require fanatical devotion to mapping buildings.
  • The basic classes of landuse we are interested can probably be derived from local knowledge, ground survey, aerial imagery etc. To make this more generally useful this requires some guidelines and consensus on tagging.
  • For now we could use tags similar to the Urban Atlas codes for urban areas in Europe and North America. Significant extension of these values might be needed to adequately cope with other areas in the world. (I'll be blogging in depth on this subject soon).
  • Looking at extending this type of data with other OSM derived variables may be interesting. Alexander Zipf mentioned that his group at Heidelberg had used a data mining approach to identify residential areas from OSM data.
If you've got any ideas of how to extend this type of classification drop me an email or comment below.

Tuesday, 18 January 2011

The Rogue Polygon and Urban Atlas


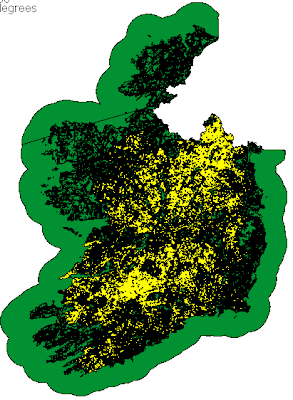
OSM's bard was having problems yesterday with Corine data for Ireland. It turned out that the Corine class 231 (permanent pasture) ran more or less continuously through Ireland from Malin Head to Kinsale Head. This created a single relation with around 17,000 members, the "rogue polygon" (see image). Needless to say required a lot of processing with osm2pgsql for rendering with mapnik. At least it might be accurate rather than the large healthcare facility that Google thinks exists in Letterkenny.

I learnt about the related EEA (European Environment Agency) project called the Urban Atlas. This uses a similar classification of landuse to Corine, but a much smaller minimum size for survey units. The maps produced have a lot of detail and look very interesting. Compared to some other countries the UK has only got coverage of a limited number of cities. But, Nottingham is included. In fact the Nottingham Urban Atlas covers a huge area apparently contiguous with the boundaries of the Districts of Erewash, Broxtowe, Rushcliffe, Ashfield, Mansfield and Gedling, and Nottingham Unitary Authority.

In some parts of Europe, such as Poland, Urban Atlas data is being prepared for import to OSM. Although not interested in the data for import I expected it data to be useful for two reasons in the first instance: completeness of coverage, and as a control for OSM tagging. The Corine division of urban fabric (roughly equivalent to OSM landuse=residential) makes useful distinctions with regards to density and continuity of urban areas, which, to date, are under represented in OSM. This type of distinction has a long history in landuse mapping. In earlier days it was concerned with urban areas which could be productive for fruit and vegetables. Nowadays, water run-off and nature conservation issues are probably more significant. As a mapper one is always aware of the difference, but I, for one, don't try and capture it explicitly. The Urban Atlas methodology has criteria which it should not be too hard to adapt for OSM, but we do need to think about appropriate tagging.

Of course the first area I looked at in the Nottingham Urban Atlas data was the two slices I've mapped this year. Part of the point of combining survey and Bing data is to capture quantitative information about landuse. So here is the area from the Urban Atlas, using the standard colour scheme:


The first thing which strikes me is that the Edwards Lane Estate is not given a uniform classification. This seems very odd: the estate is clearly a single uniform design including road widths, garden sizes, house types. I assume that it was planned with a specific population density in mind, and specific guidelines in terms of percentage of the area devoted to houses, gardens, open space and road infrastructure. Here's the same data with houses I've recently mapped in OSM : it's very clear that areas with identical numbers of identical houses have been assigned to different categories:


So note the darker red areas with code 11210 : on the ground this is indistinguishable from the rest of the estate (coded 11220) . All I can conclude is that the data were not subjected to ground validation: an overview of the methodology is shown in this presentation. Detailed inspection of other well-mapped areas reveals similar minor anomalies: industrial and commercial areas spilling over to residential blocks; areas in campuses (colleges, hospitals and universities) being incorrectly assigned to residential categories; and soon and so forth. These nuances probably don't affect the reliability of the data for its purpose, but they do reflect how the data was sourced. One issue might be how parcel boundaries are selected, which may have the effect of putting all of some shared resource in one parcel (such as a kids' playground). I'd hoped to find time to measure housing density based on OSM data for the shapes shown above, and thus have more confirmation. It will have to wait for another time.

The bottom line: this sort of data set can be created as a side effect of areas which have already been mapped in OSM. A small amount of additional tagging is needed on residential areas, but otherwise a comparable dataset can already be produced for much of the Nottingham area. The EEA should start considering OSM as a primary source for any extensions of this dataset in places like Germany and many parts of the UK. OSM data is likely to be more accurate, reflect better understanding of the locale, and be more up-to-date.

Postscript. I find it slightly boggling that I'm disparaging a data set which two years ago I would have thought was fantastic. It's great to find how powerful OSM is becoming.