 |
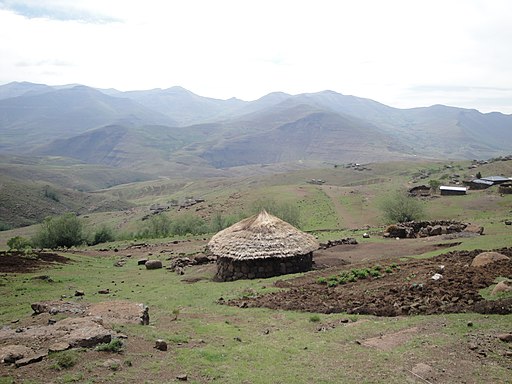
| A village in Mokhotlong District. This is S of the area I have mapped, but looks similar on aerial photos. Source: Wikimedia Commons. |
I've use the Task Manager fairly rarely, but development over the past year has added one feature which for makes it much easier to use: the creation of a bounding box in the JOSM editor. It is now much simpler to see the area one has undertaken to map. This in turn is important in reducing editing conflicts and redundant work.
In practice after completing 4 tasks, and realising I was unlikely to clash with other edits I started roving more widely. The reasons behind this were four fold:
- Mapping lots of a single feature can get very boring. It helps to maintain interest by varying the range of tasks. As I'd started in a very mountainous area I was more-or-less only mapping cliffs and streams.
- A basic context for mapping can often help a great deal in teasing out further detail from aerial photos: particularly for places where one has no on-the-ground experience.
- I was not picking up any 'culture' (human habitations, roads, tracks) etc. in my initial squares and although natural features are fine this was not the first priority of the mapathon.
- My usual editor is Potlatch and I was having problems picking out some features from the aerial imagery in JOSM
 | |
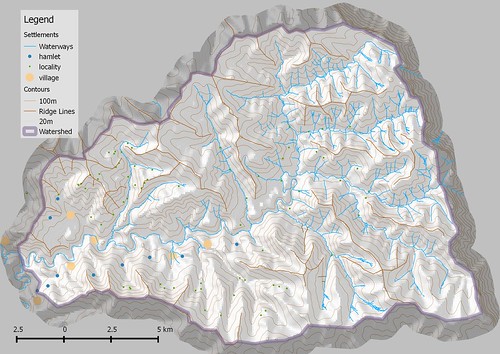
| Overview of the main area in which I mapped. Mainly OSM data accessed via Overpass-Turbo with contours from SRTM and hillshading from ASTER. copyright OpenStreetMap contributors CC-BY-SA |
I've tried to add as much detail as is feasible, but the various visualisations still look rather bare. I think that what is missing and would give the map more life are the names of villages, hamlets, streams, and rivers. I did check the US Military map, but am not at all sure whether the names on this are current: they certainly don't appear to correspond to anything on the list of places from the 2011 Lesotho census.
View Larger Map
Mapped Features
With this sort of aerial mapping one can only work with a fairly small set of features to map. The ones I used frequently were:- waterways: I mainly mapped these as streams. Many look to be intermittent, although that is very difficult to judge from aerial imagery and some clearly supported a different vegetation even if not apparently flowing.
- residential landuse: most villages and hamlets were nucleated. Only one place had buildings spread over a more diffuse area. This made adding residential landuse pretty easy. In turn this made finding places to map buildings easier later on.
- farmland landuse: the places I mapped as landuse=farmland are presumably entirely given over to growing crops. Places used for pasturage, either around villages or in the mountains are not clear. In the highland area that I was mapping areas of cropland stand out quite clearly, and are often highly discrete: presumably reflecting details of the local topography (soils, insolation, water availability and so on).
- places: I categorised settlements either as villages (roughly those with over 100 buildings), hamlets (usually around 25 (10-50) buildings) and localities (1-3 buildings). The latter I presume to mainly be huts occupied by herdsmen for some time during the summer months. These were nearly always accompanied by 2 or 3 walled enclosures, which I assume are used for cattle.
- walls: the only walls I mapped were those associated with the highland isolated localities. In most villages there were also quite a few walls, some may represent old buildings. I chose not to map any of these.
- buildings: the bulk of buildings were small round structures which I interpret to be mokhoro. The rest were mainly rectangular buildings which were somewhat larger than the traditional huts. After I mapped the basic buildings I realised that both types lend themselves readily to some simple 3Dshapes tags, so I added these too.
- roads and paths: I ended up using relatively few tag values for highway. Most things I tagged with highway=path, with the intention of implying its most basic meaning: a path which might be used by foot or horse or bicycle or motorbike. I spent quite a bit of time before choosing this over track, but careful scrutiny failed to reveal many routes with evidence of passage of 4-wheeled vehicles. Those that did clearly fulfilled more important purposes than those of a track, so I accorded them unclassified or tertiary road status. Other mappers may well have used track for both things I've tagged as a path and for things I've tagged as a road.
- cliffs: because the Drakensberg is made up from multiple layered basalt lava flows it has lots of cliffs! Choosing which to map was slightly arbitrary, as some are little more than a surface rock exposure. In many cases I was guided by the size of shadows in choosing what to map.
- ridgelines: initially I mapped these to help delineate the area I wanted to map. When I discovered that OpenMapSurfer renders them I added more and refined the ones I had already mapped.
Using the HOT Tasking Manager
I'm a very occasional user of the tasking manager, the last time I used it was in validating a square after Typhoon Haiyan/Yolanda. These are a few observations about my experience of its use:Rectangular Task Grid: The use of existing square tiles has many advantages, not least that an grid can be laid down automatically in the aftermath of a disaster, and it lends itself to automatic subdivision.
However, I personally would find the ability to define arbitrary polygons (aka cake slices) for tasks very helpful. In validating mapping of buildings in the Philippines I found I was using roads to delineate search areas within my square. A scanning search strategy (e.g, from W to E and N to S) is often quite difficult to pursue steadily for validation because it is often important to frequently zoom in and out, and it is quite easy to lose ones place in the scan. When mapping linear features such as roads will also tend to pull the mapper away from a systematic examination of the imagery.
Completion: Completion of a square must be considered against the given task. For the Lesotho Mapathon the task was quite diffuse: "map all settlements, roads and major natural features, particularly rivers & streams within your allotted area". Even in squares which I marked as completed I have subsequently added quite a bit of data: most significantly isolated dwellings and paths connecting them. These were not obvious at the zoom levels used for initial mapping (z15-z16) and mainly were picked up by detecting paths at high zoom levels and following them. In general nothing mapped on OSM is ever done, completeness is only approached asymptotically. It should always be possible to find new things to map or refine existing data: even in well mapped places.
Patchiness: grid (or polygon) based tasking favours a depth-first not breadth-first mapping approach. When available mappers outweigh tasks this isn't a problem, and the tasking avoids duplication of work and edit conflicts. However, in many HOT tasks a surplus of mappers is not the issue (at least in part because new tasks are arriving all the time).
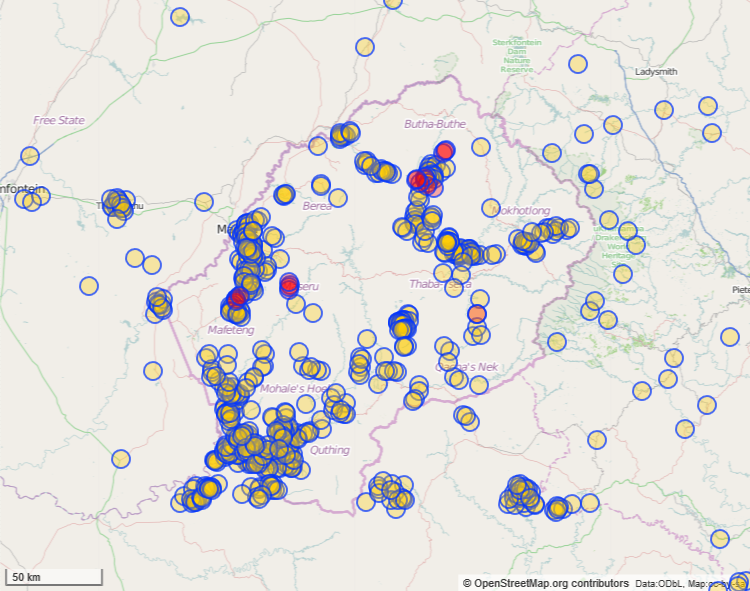
Two images show this for Lesotho:
 |
| Butha-Buthe, a town in Lesotho, showing severe mapping disparities between task grid squares. |
.png) |
| Distribution of places tagged as villages in Lesotho and surrounding parts of S Africa. Captured 3 August 2014 using Overpass-Turbo. |
.png) |
| An additional 52 village nodes added whilst writing up this point. Note: some had been partially mapped as residential landuse. |
Now I suspect that during the development of Tasking Manager many of these things were thought about, but got dropped on the KISS principle!
A little bit about the data
One of the great things with OSM data is that once its been created one can start using it to ask questions. To assist in this I downloaded SRTM and ASTER data to create a set of contours for Lesotho. In principle one can then ask questions like:- What height are villages & hamlets in the area mapped?
- What is the maximum elevation of farmland?
- What is the relationship between cultivated areas and numbers of dwellings?
- Most settlements appear to be fairly nucleated. Is this true?
- What is the average level of insolation of farm and non-farm areas close to villages?
There are others which relate to what we have mapped:
- When buildings have thatched roofs: what plants are used for the thatch? what timber is used for the roof frame? Can we map the location of these resources?
Conclusion
I just mapped one tiny corner of Lesotho, and am perfectly aware that there's still more to map in that area. Lesotho Mapathon activities continue. If you fancy mapping something a little bit different, or even starting out mapping, there are plenty of opportunities in the coming weeks.For myself I'm likely to contribute mainly by continuing trying to identify settlements so that we get a broadly based map of the country as well as fantastic detail in places.
No comments:
Post a Comment
Sorry, as Google seem unable to filter obvious spam I now have to moderate comments. Please be patient.