 |
| View S from the Cathedral of Learning in Oakland, Pittsburgh, showing some urban areas used as tests in this post.
The incised valley of the Monogahela in the background contained railways and steel works. The plateau beyond has residential suburbs of Pittsburgh. To the left foreground are the woods and ravines of Schenley Park, with a residential area beyond. Source: Zack Weinberg via Wikimedia Commons CC-BY-SA
|
One of the obvious features of the highway network for the USA on OpenStreetMap is that road density is much higher in built-up areas. I started looking at how to measure this, when I recalled a method for identifying city blocks introduced to me by a Brazilian user of OpenStreetMap data.
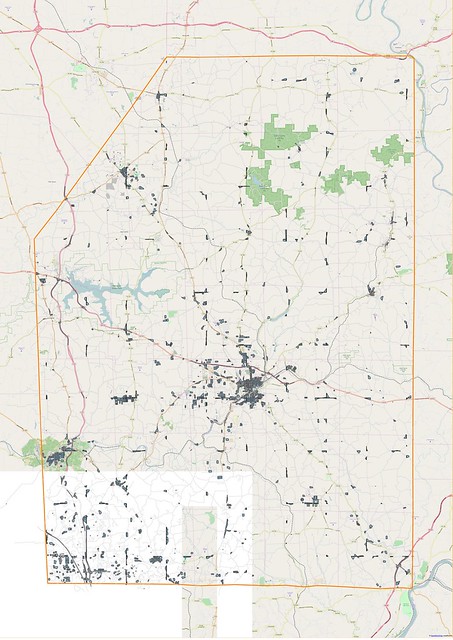 |
| Residential Areas for Butler Co, Pennsylvania, identified with the block method from OpenStreetMap data. Orange line outlines Butler County. |
The method itself is also really quite simple:
- Take the main road network for some area and make a union of it (which will be a MULTILINESTRING).
- Polygonize this data, and decompose to individual polygons.
First off I did this for Butler County, to test the process and iron out teething problems with the SQL (see above). The main changes I made are:
- to perform the initial creation of blocks using a 3 minute grid. In order to avoid losing blocks at the edges of each grid square, the grid square as a linestring needs to be included in the block generation. I achieved this by:
SELECT grid_guid, geom
FROM pa_roads_gridded
UNION ALL
SELECT grid_guid, st_exteriorring(geom)
FROM pa_3minute_grid
- In the decomposition phase the area of each polygon is calculated, and only polygons with an area of under 100000 included (units in Spherical Mercator, actual areas are about half the size in square metres).
- All blocks within a grid square are merged if they touch to form a number of larger polygons. (This uses the same method as before for identifying each distinct graph).
- Finally the larger polygons which touch are merged across grid squares.
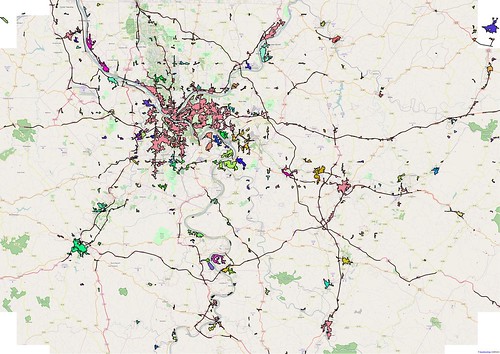 |
| Urban Areas for the Pittsburgh region, derived using the 'block' method described here. Each polygon is coloured randomly to help show the boundaries. Interstates & other dual-carriageways create significant artefacts. |
Looking at Pennsylvania as whole, and the Pittsburgh conurbation in particular, reveals quite reasonable identification of urban areas with one big problem. The problem is freeways, specifically interstates, but in practice it applies to any dual carriageway. These not only produce long linear extensions of the main urban areas, but actually cause areas which are not contiguous to fuse.
There are a number of approaches to correcting these artefacts:
- Simply exclude highway=motorway in the initial step. This would probably work OK for Pennsylvania, but would not, for instance, work in the UK where many highway=trunk roads are dual carriageways.
- Introduce some compactness measure for each initial polygon (e.g., ratio of perimeter to area, or ratio of area to area of an enclosing circle) , and exclude polygons over a certain threshold. This is probably the easiest to do in the short term.
- Generalise dual carriageways to a single line feature before creating blocks. This is complex, the only solution I know of specifically for OSM data is the VB6 one written for CityGuide. However, this is a general problem (skeletonization) whose solution would help in a whole range of areas: for instance, better cartography for small scales; 1-dimension maps; automated address interpolation.
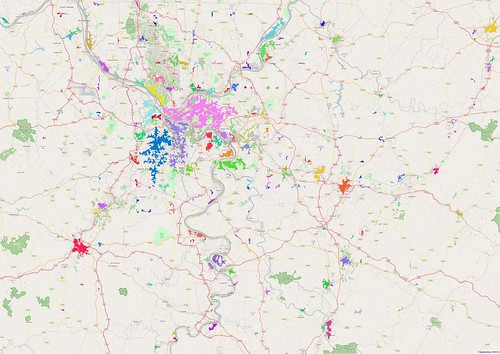 |
| Urban Areas for the Pittsburgh region, derived using the modified 'block' method described above. Each polygon is coloured randomly to help show the boundaries. Compare with image above. |
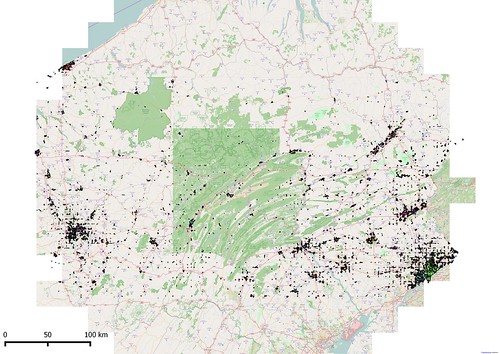 |
| Pennsylvania Urban Areas using modified block method. Grid artefacts are very clear at this scale. The vignetting of OSM tiles is not deliberate, but due to vagaries of the OpenLayers plugin for QGIS |
Some fairly simple improvements to the polygons — for instance clipping to ensure they don't overlap existing landuse type polygons — could make them suitable for reincorporation within OSM as residential areas. Two utilities may be available, the Snapshot Server and OSMLY, which would allow such data to be used on a case-by-case basis when suitable by individual mappers.
Another application would be to more easily reduce the number of highway=residential roads which are candidates for retagging.
This comment has been removed by a blog administrator.
ReplyDelete