Showing posts with label conflation. Show all posts

Wednesday, 2 December 2015

How accurately have Townlands in Northern Ireland been mapped?

From time-to-time newly released Open Data provides a nice opportunity to check OpenStreetMap for its accuracy in all its forms (see Hakaly (2008) for a breakdown of what this can mean).

Coastal Townlands, Cos. Derry & Antrim
Coastal Townlands, Counties Derry/Londonderry and Antrim.
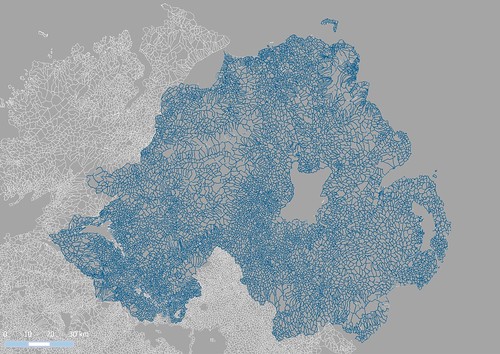
Boundary lines see below. The deeper the colour of the area, the greater discrepancy in the area of the OSM polygon and the OSNI one. The pale base colour represents a divergence of under 2%. Townlands on the coast and on the UK/Ireland border seem to  be most likely to diverge in size. The small cluster centre right is caused by different ways of handling townlands which cross a Civil Parish boundary (OSM & the original source GSGS 3906 split these, the OSNI data does not).
We have known for a while that both the Ordnance Survey of Northern Ireland and the Ordnance Survey of Ireland were planning OpenData releases. When they came it was all in a rush. For now the hard work starts of checking license conditions for suitability for use in OSM and other places, as well as then working out what is really useful. However, because the townland boundaries of Northern Ireland are complete, it was an ideal opportunity to look at accuracy.

View along N side of MacGilligan Peninsula towards Inishown from Umbra

My reasons for doing this are not just pure interest. The usefulness of the Irish Vice County boundaries depends of their positional accuracy. Earlier my prediction was that such boundaries ought to be within 10 metres of their true location on the ground where they were based on townland boundaries, but this was largely based on experience with other OSM data rather than an objective statement. Thus investigating the accuracy using an independent data set provides an excellent way of testing this statement. The tests need to be done now, because (as we shall see) the nature of OSM is to fix issues spotted very quickly, and thus datasets become loosely coupled.

I adopted two approaches:
  1. A straight comparison of areas (or their ratios).
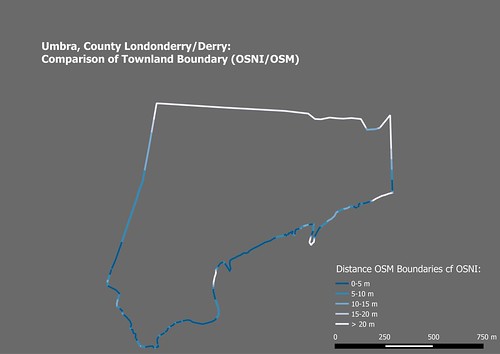
  2. Using a series of buffered boundaries from one source (OSNI) and seeing what proportion of the other source (OSM) was included in each buffer.
To choose which townlands to compare I followed a suggestion of Rory McCann and for each OSM townland selected the one which shared the most area in common from the OSNI data set. (I have also done it on matching names for a smaller set of data & get similar results). Note that I am comparing townland with townland, not boundary segment with boundary segment. This means that each boundary segment (other than coastal, lacustrine or riverine ones) will be included twice.

umbra_townland_cf
Buffering approach to investigating boundary accuracy.
Demonstrated with Umbra townland in County Derry/Londonderry.
This is predominantly coastal sand dunes, with a small river running along its S boundary.
Northern Ireland Townlands OSNI comparison
Northern Ireland using the same colouring.
At this scale very few boundary mismatches are apparent.
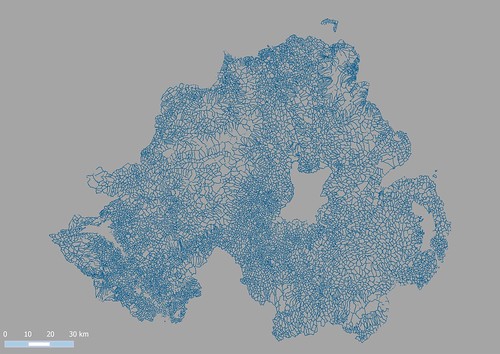
The buffering approach is based on that described by Hakaly (2008). I used buffers of 5, 10, 15 and 20 m, and then clipped the initial OSM way be each in turn.  On the scale of the whole country it is clear that most boundaries match closely. This is confirmed by checking what proportion of the boundaries fall into each buffer class: over 80% are within 5m, over 90% within 10m and nearly 95% within 20m.


Closer inspection (as with the Umbra) shows much of the discrepancy to be present along the coast. This is not surprising, coastlines on OSM were originally derived automatically, and even when refined by hand are unlikely to accord with Mean High Water (MHW). Certainly, for my purposes, it is merely important that the OSM coastlines do not stray above MHW.

NI Townlands, all boundaries within 5 m of OSNI
OSM townland Boundaries within 5m of OSNI data
The analysis described so far focusses on positional accuracy. Looking at areas highlights a range of other accuracy issues.

townlands_ni_cf9
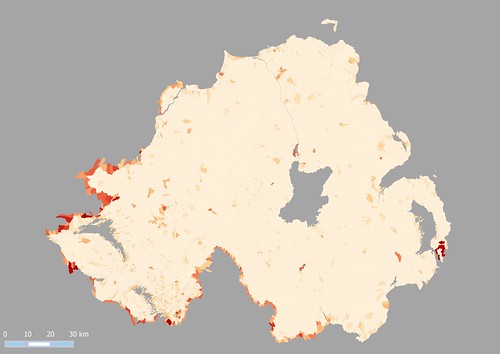
Area comparison. Townlands are coloured according to absolute variance of ratio of areas from 1.
The redder they are the further the ratio is from 1.
Area discrepancies of over, say 5%, may be the result of any of the following:
  • Boundary discrepancy (such as coastlines). Mainly caused by coastlines, or difficulty of delineating some boundary feature, such as the course of the Umbra river above) 
  • Erroneous interpretation of the boundary on old maps causing selection of the wrong feature. This transfers land from one townland to another, therefore these should cluster. 
  • Missing townlands. When a single townland has been created without noticing one or more others inside it (Town Parks townland at Ballymoney is an example). 
  • Different treatment of townlands bisected by a Civil Parish. See caption of first image above. Incorrect tagging. 
  • Higher level administrative units having tags appropriate to a townland. I've noted two cases of this one of which was Ballyphilip CP on the Ards peninsula in County Down. 
  • Islands. Some offshore islands appear to be missing from the OSNI data (see The Skerries N of Portrush)
We've already caught a few examples in each of these classes through this analysis, and no doubt will find a few more. I have not yet investigated the very apparent discrepancy along the borders.

To conclude, townland boundaries show exactly the kind of positional accuracy we expected (or perhaps hoped). Perhaps 1% of the total data (90-100 townlands from about 9000) may need some form of correction. I'm biased, but this seems pretty good, for a project principally relying on rectified photo-reduced maps from 1939! It's also worth remembering, that unlike road comparisons, there is no widely available sensor data (ie GPS tracks/point) to help boundary alignments.

When time permits I'll extend this to include OSI Open Data too. A big thanks to both organisations for releasing their Open Data. OSNI staff have been contributors to OSM for a while: they host Missing Maps lunchtime sessions in their offices.

How accurately have Townlands in Northern Ireland been mapped?

From time-to-time newly released Open Data provides a nice opportunity to check OpenStreetMap for its accuracy in all its forms (see Hakaly (2008) for a breakdown of what this can mean).

Coastal Townlands, Cos. Derry & Antrim
Coastal Townlands, Counties Derry/Londonderry and Antrim.
Boundary lines see below. The deeper the colour of the area, the greater discrepancy in the area of the OSM polygon and the OSNI one. The pale base colour represents a divergence of under 2%. Townlands on the coast and on the UK/Ireland border seem to  be most likely to diverge in size. The small cluster centre right is caused by different ways of handling townlands which cross a Civil Parish boundary (OSM & the original source GSGS 3906 split these, the OSNI data does not).
We have known for a while that both the Ordnance Survey of Northern Ireland and the Ordnance Survey of Ireland were planning OpenData releases. When they came it was all in a rush. For now the hard work starts of checking license conditions for suitability for use in OSM and other places, as well as then working out what is really useful. However, because the townland boundaries of Northern Ireland are complete, it was an ideal opportunity to look at accuracy.

View along N side of MacGilligan Peninsula towards Inishown from Umbra

My reasons for doing this are not just pure interest. The usefulness of the Irish Vice County boundaries depends of their positional accuracy. Earlier my prediction was that such boundaries ought to be within 10 metres of their true location on the ground where they were based on townland boundaries, but this was largely based on experience with other OSM data rather than an objective statement. Thus investigating the accuracy using an independent data set provides an excellent way of testing this statement. The tests need to be done now, because (as we shall see) the nature of OSM is to fix issues spotted very quickly, and thus datasets become loosely coupled.

I adopted two approaches:
  1. A straight comparison of areas (or their ratios).
  2. Using a series of buffered boundaries from one source (OSNI) and seeing what proportion of the other source (OSM) was included in each buffer.
To choose which townlands to compare I followed a suggestion of Rory McCann and for each OSM townland selected the one which shared the most area in common from the OSNI data set. (I have also done it on matching names for a smaller set of data & get similar results). Note that I am comparing townland with townland, not boundary segment with boundary segment. This means that each boundary segment (other than coastal, lacustrine or riverine ones) will be included twice.

umbra_townland_cf
Buffering approach to investigating boundary accuracy.
Demonstrated with Umbra townland in County Derry/Londonderry.
This is predominantly coastal sand dunes, with a small river running along its S boundary.
Northern Ireland Townlands OSNI comparison
Northern Ireland using the same colouring.
At this scale very few boundary mismatches are apparent.
The buffering approach is based on that described by Hakaly (2008). I used buffers of 5, 10, 15 and 20 m, and then clipped the initial OSM way be each in turn.  On the scale of the whole country it is clear that most boundaries match closely. This is confirmed by checking what proportion of the boundaries fall into each buffer class: over 80% are within 5m, over 90% within 10m and nearly 95% within 20m.


Closer inspection (as with the Umbra) shows much of the discrepancy to be present along the coast. This is not surprising, coastlines on OSM were originally derived automatically, and even when refined by hand are unlikely to accord with Mean High Water (MHW). Certainly, for my purposes, it is merely important that the OSM coastlines do not stray above MHW.

NI Townlands, all boundaries within 5 m of OSNI
OSM townland Boundaries within 5m of OSNI data
The analysis described so far focusses on positional accuracy. Looking at areas highlights a range of other accuracy issues.

townlands_ni_cf9
Area comparison. Townlands are coloured according to absolute variance of ratio of areas from 1.
The redder they are the further the ratio is from 1.
Area discrepancies of over, say 5%, may be the result of any of the following:
  • Boundary discrepancy (such as coastlines). Mainly caused by coastlines, or difficulty of delineating some boundary feature, such as the course of the Umbra river above) 
  • Erroneous interpretation of the boundary on old maps causing selection of the wrong feature. This transfers land from one townland to another, therefore these should cluster. 
  • Missing townlands. When a single townland has been created without noticing one or more others inside it (Town Parks townland at Ballymoney is an example). 
  • Different treatment of townlands bisected by a Civil Parish. See caption of first image above. Incorrect tagging. 
  • Higher level administrative units having tags appropriate to a townland. I've noted two cases of this one of which was Ballyphilip CP on the Ards peninsula in County Down. 
  • Islands. Some offshore islands appear to be missing from the OSNI data (see The Skerries N of Portrush)
We've already caught a few examples in each of these classes through this analysis, and no doubt will find a few more. I have not yet investigated the very apparent discrepancy along the borders.

To conclude, townland boundaries show exactly the kind of positional accuracy we expected (or perhaps hoped). Perhaps 1% of the total data (90-100 townlands from about 9000) may need some form of correction. I'm biased, but this seems pretty good, for a project principally relying on rectified photo-reduced maps from 1939! It's also worth remembering, that unlike road comparisons, there is no widely available sensor data (ie GPS tracks/point) to help boundary alignments.

When time permits I'll extend this to include OSI Open Data too. A big thanks to both organisations for releasing their Open Data. OSNI staff have been contributors to OSM for a while: they host Missing Maps lunchtime sessions in their offices.

Thursday, 31 October 2013

Not very INSPIREd: Land Registry 'Open' Data

Many OpenStreetMap contributors have been very excited about the potential for importing address information from data sets released under the European Union's INSPIRE directive. Our experience in the UK tends to make us more cautious in our expectations, and so it proved with the latest release of Open Government Data under this programme.

Comparison of Land Registry parcels with gardens on OSM in Sutton Coldfield
Scatter plot with log-log scale.
Firstly, (another) quick word about the complexities of organisation of cadastral data in the UK. There are separate cadastral agencies for each of England and Wales, Scotland, and Northern Ireland (note the Oxford comma), which run in different ways: not least because the legal framework of Scot's Law is quite different from English Law. Thus the data released only relates to England and Wales.


Thursday, 24 March 2011

Why do lamp-posts have asset numbers?

IMG_2042aA few weeks ago there was an involved, and sometimes, heated, discussion on the main OSM mailing list about imports. Many of the comments were interesting and useful, but one particular strand has attracted my attention. A slightly grotesque paraphrase of these various messages might be "OSM is a poorly managed Computer Science project, with inadequate tools, particularly for version control."

Leaving aside that OSM is neither a project, nor managed: I'd like to focus on what seems to be a surprising mis-perception about OSM as a database.

Firstly, databases don't have to be digital or stored electronically. Phone books, card indexes, and many reference books are easily recognisable as databases. Therefore a primitive database operation is only valid if it can be applied also to non-digital media.

Secondly, and this directly follows, information stored in a database does not have to have a unique identifier (a primary key). There's nothing stopping a telephone number appearing several times in a phone book, or complete pages being duplicated.

Once data is moved onto digital media, it really helps to assign unique identifiers: data can be restructured to be stored more efficiently or be easier to change; it's easier to spot duplication or bad data. This is exactly what OSM does, nodes, ways and relations are identified internally by system generated keys.

And it's what my local council does. They maintain an asset register of street furniture (bollards, traffic signals, parking signs, parking meters) and within this application assign identifiers. These days all this information is geocoded and available in the council's GIS. This information is obviously useful for financial planning, maintenance and other activities. BUT, they've gone a step further and each asset now has it's system assigned number marked on it. WHY? Because, "replace the bulb in lamp 35621" is a lot more specific than "replace the bulb in the lamp outside 25 Main Street". There may be lamp standards opposite each other at that location, or there might be two Main Street's or there may be no number on 25 Main Street, or the house might have been demolished. However, this number DOES NOT uniquely identify the lamp-post: it might do when combined with its location data, location data of the organisation which has assigned the number and information about the status of the system used to generate the number.

What does this have to do with OSM (apart from the wonderful possibility of collecting lamp-post numbers). Well OSM is like my local council, except that our local patch is a bit bigger, and we cannot go stencilling numbers on anything we map. So we have no means to tie an OSM object to its corresponding thing in the real world.

A corollary to this is that we cannot confidently tie OSM objects to geolocated objects in other databases. There are far too many variables to even inspire confidence in fuzzy matches: when was the OSM data mapped? what sources were used? how accurately was it mapped? when was the external data mapped? how current is it? how complete is it? does it have unique identifiers? are the identifiers persistent?

So, we have a host of problems in matching data from an OSM dataset and an equivalent external dataset. These problems relate to location accuracy, temporal accuracy, matching identifiers, and accuracy of associated data.

A good example of these problems is shown by OS Locator Musical Chairs and ITO's OSM Analysis which compare OSM street name data for Great Britain with the OpenData Locator dataset from the Ordnance Survey. This is a nice clear domain with the OS Locator data being from a known source and date and from a highly reputable national mapping agency. In some areas we have enough separately sourced data in OSM to have a handle on how accurately we can match these datasets. In most areas in England about 0.5-1.0% of Locator records cannot be matched to OSM. (I am not aware of reverse statistics, but in a recent survey aimed at hunting down some 20-odd of the mis-matches I found 5 street names used for addresses which are not present in the OS dataset). Even different datasets from OSGB have enough inconsistency to prevent complete matching. And these cases are relatively easy ones.

There are also problems relating to the purpose of external datasets: cadastral data might not reflect the building outlines we would draw naturally (e.g., French & Spanish cadasters); hydrography data might be segmented for water-flow measurement (e.g., NHD); vector data might be optimised for rendering (OS OpenData VectorMapDistrict); road data might not need to be very accurate (TIGER). The imported data should be restructured to reflect what is important for OSM, not maintained in aspic for some putative update.

So those advocating data imports or having 'development forks' of OSM need to answer : how on earth can you easily relate objects between two different data sets, or even the same data set at different times. Alternatively, we could all add some stencils to our mapping toolkits, but even then we'd have to leave our armchairs.

Postscript: the council are busy replacing all the local lamp posts, wonder what number they'll put on the new ones.