Showing posts with label completeness. Show all posts

Wednesday, 25 July 2018

Coda on shop completion rates on OSM

Thanks to John Baker (Rovastar) for a few suggestions discussing my recent blog post in the pub last night:

  • What do the graphs of numbers of unique shop tags look like with heavier filtering of relatively poorly used tags.
  • E-cigarette shops are a recent phenomenon, and should represent a genuinely novel tag rather than the mix of typos, synonyms etc which characterise much of the long tail of shop tags.

These were easy to follow up, so I present the graphs here:

Unique shop tags over time on OpenStreetMap for Great Britain,
filtered to remove tags with a restricted number of uses as at June 2017.
For virtually any level of filtering the curves level out around 2010-2011. Thus the core set of shop tags looks to be very stable. A good place to judge the extent of likely synonymy for shops in Britain is the LUA script used by SomeoneElse for his "Useful Maps".

Growth of mapped e-cigarette shops in GB on OSM
As expected e-cigarette shops first appeared rather late, at the end of 2013, and there are a decent number mapped (over 200 by mid 2017). I haven't checked, but I suspect the sharp increase in 2017 was caused by some tagging rationalisation. It's not unusal for new things to acquire a range of synonyms before tagging stabilises and one value becomes favoured. (It's equally true that in some cases this does not happen).

I've had a couple of other requests which it will take rather longer to look at, but if you have ideas relating to shops in Great Britain I can look at the data right now.

Tuesday, 24 July 2018

Can we identify 'completeness' of OpenStreetMap features from the data?

At the Milan SotM conference Stefan Keller from the Geometalab at HSR (Rapperswil) will talk about recent work of his group on identifying "Areas of Interest" (AoI) from OpenStreetMap data. Stefan has been kind enough to involve me in some discussions about this work as it has progressed, but in this post I am solely concerned with a separate issue arising from the use of points of interest in this work.

Growth of shops mapped on OSM for selected Local Authorities
(See Analysis section below for commentary)


Areas of Interest were introduced on Google Maps back in 2016. Loosely they correspond to shopping, entertainment and cultural areas with large clusters of relevant points of interest. No doubt Google not only used map features, but also other sources of data such as location of Android phones to calculate the footprints for Areas of Interest (shown in a pale orange or salmon colour on Google Maps).

There are issues with the Google implementation, some discussed in this CityLab article from 2016. My own examination of Google Maps confirms that shopping areas which are otherwise equivalent in range and type of shops are chosen as AoI in wealthy areas, but not in poorer areas dominated by social housing. I also found some places, notably the UBS IT centre in Altstetten, Zurich, which have erroneously been identified as AoI by Google. The work of Geometalab is therefore interesting not just in terms of whether OSM data can be used to calculate similar areas, but also to provide suitable data where biases based on socioeconomic status can, at least, be identified and corrected because data and code are open.

Zurich, centre and Aussersihl districts, showing Areas of Interest.
Work of Geometalab, derived from OpenStreetMap data.
The starting point for this type of work relies on areas where POI mapping density is high and reasonably complete (for instance, the areas of Switzerland which Stefan's group have looked at, and areas of the English East Midlands and Germany which I have looked at both recently, and in the past). Given that it is possible to calculate reasonable AoIs from OSM data where PoI density is high, the question arises "Can we identify which areas are 'reasonably' complete?". Normally, this type of work has involved comparing OSM data to some external reference data which are assumed for the purposes of comparison to be complete (for instance Peter Reed's work on UK retail). However, in many parts of the world, and for many topic domains there is no readily usable data for this purpose. So the ancillary clause for the question is ", and we do this with OSM data alone?"

This post is a first look at the problem for one class of POIs:  shops.


Wednesday, 2 December 2015

How accurately have Townlands in Northern Ireland been mapped?

From time-to-time newly released Open Data provides a nice opportunity to check OpenStreetMap for its accuracy in all its forms (see Hakaly (2008) for a breakdown of what this can mean).

Coastal Townlands, Cos. Derry & Antrim
Coastal Townlands, Counties Derry/Londonderry and Antrim.
Boundary lines see below. The deeper the colour of the area, the greater discrepancy in the area of the OSM polygon and the OSNI one. The pale base colour represents a divergence of under 2%. Townlands on the coast and on the UK/Ireland border seem to  be most likely to diverge in size. The small cluster centre right is caused by different ways of handling townlands which cross a Civil Parish boundary (OSM & the original source GSGS 3906 split these, the OSNI data does not).
We have known for a while that both the Ordnance Survey of Northern Ireland and the Ordnance Survey of Ireland were planning OpenData releases. When they came it was all in a rush. For now the hard work starts of checking license conditions for suitability for use in OSM and other places, as well as then working out what is really useful. However, because the townland boundaries of Northern Ireland are complete, it was an ideal opportunity to look at accuracy.

View along N side of MacGilligan Peninsula towards Inishown from Umbra

My reasons for doing this are not just pure interest. The usefulness of the Irish Vice County boundaries depends of their positional accuracy. Earlier my prediction was that such boundaries ought to be within 10 metres of their true location on the ground where they were based on townland boundaries, but this was largely based on experience with other OSM data rather than an objective statement. Thus investigating the accuracy using an independent data set provides an excellent way of testing this statement. The tests need to be done now, because (as we shall see) the nature of OSM is to fix issues spotted very quickly, and thus datasets become loosely coupled.

I adopted two approaches:
  1. A straight comparison of areas (or their ratios).
  2. Using a series of buffered boundaries from one source (OSNI) and seeing what proportion of the other source (OSM) was included in each buffer.
To choose which townlands to compare I followed a suggestion of Rory McCann and for each OSM townland selected the one which shared the most area in common from the OSNI data set. (I have also done it on matching names for a smaller set of data & get similar results). Note that I am comparing townland with townland, not boundary segment with boundary segment. This means that each boundary segment (other than coastal, lacustrine or riverine ones) will be included twice.

umbra_townland_cf
Buffering approach to investigating boundary accuracy.
Demonstrated with Umbra townland in County Derry/Londonderry.
This is predominantly coastal sand dunes, with a small river running along its S boundary.
Northern Ireland Townlands OSNI comparison
Northern Ireland using the same colouring.
At this scale very few boundary mismatches are apparent.
The buffering approach is based on that described by Hakaly (2008). I used buffers of 5, 10, 15 and 20 m, and then clipped the initial OSM way be each in turn.  On the scale of the whole country it is clear that most boundaries match closely. This is confirmed by checking what proportion of the boundaries fall into each buffer class: over 80% are within 5m, over 90% within 10m and nearly 95% within 20m.


Closer inspection (as with the Umbra) shows much of the discrepancy to be present along the coast. This is not surprising, coastlines on OSM were originally derived automatically, and even when refined by hand are unlikely to accord with Mean High Water (MHW). Certainly, for my purposes, it is merely important that the OSM coastlines do not stray above MHW.

NI Townlands, all boundaries within 5 m of OSNI
OSM townland Boundaries within 5m of OSNI data
The analysis described so far focusses on positional accuracy. Looking at areas highlights a range of other accuracy issues.

townlands_ni_cf9
Area comparison. Townlands are coloured according to absolute variance of ratio of areas from 1.
The redder they are the further the ratio is from 1.
Area discrepancies of over, say 5%, may be the result of any of the following:
  • Boundary discrepancy (such as coastlines). Mainly caused by coastlines, or difficulty of delineating some boundary feature, such as the course of the Umbra river above) 
  • Erroneous interpretation of the boundary on old maps causing selection of the wrong feature. This transfers land from one townland to another, therefore these should cluster. 
  • Missing townlands. When a single townland has been created without noticing one or more others inside it (Town Parks townland at Ballymoney is an example). 
  • Different treatment of townlands bisected by a Civil Parish. See caption of first image above. Incorrect tagging. 
  • Higher level administrative units having tags appropriate to a townland. I've noted two cases of this one of which was Ballyphilip CP on the Ards peninsula in County Down. 
  • Islands. Some offshore islands appear to be missing from the OSNI data (see The Skerries N of Portrush)
We've already caught a few examples in each of these classes through this analysis, and no doubt will find a few more. I have not yet investigated the very apparent discrepancy along the borders.

To conclude, townland boundaries show exactly the kind of positional accuracy we expected (or perhaps hoped). Perhaps 1% of the total data (90-100 townlands from about 9000) may need some form of correction. I'm biased, but this seems pretty good, for a project principally relying on rectified photo-reduced maps from 1939! It's also worth remembering, that unlike road comparisons, there is no widely available sensor data (ie GPS tracks/point) to help boundary alignments.

When time permits I'll extend this to include OSI Open Data too. A big thanks to both organisations for releasing their Open Data. OSNI staff have been contributors to OSM for a while: they host Missing Maps lunchtime sessions in their offices.

Saturday, 15 June 2013

Completeness of post box mapping in Britain

I'm always on the look-out for ways to visualise the degree of completeness of OpenStreetMap data. Although it's often possible to perform quantitative analysis, such as the work done by Peter Reed on supermarkets in the UK, it's usually a lot harder to show the geographic element, even when a comparative data set is available.

Thinking about this last night I realised that Geolytix's Postcode Sector open data would allow comparison between the list of post boxes released by the Royal Mail in 2009 and OpenStreetMap data. Although the Royal Mail data is not geocoded it does contain a reference for each postbox which includes the postal district  in which the box is located. OSM data can be directly matched to postal districts with a point within polygon query. The result is here:

OSM Postboxes by postal district
Percentage of Royal Mail postboxes mapped on OSM by Postal District

Note that the Royal Mail data is available as the result of a Freedom of Information request: copyright remains with the Royal Mail. I merely counted the number of rows in the tab-separated file for each postal district.

Producing the image took me way longer than I hoped. Reasons included bugs in QGIS regarding handling smallint and int columns from Postgres, a weird bug where the QGIS Print Composer refused to do anything sensible with a scale of 1:4,000,000, grappling with the new label formatter in QGIS, query performance; and adding attribution statements. In the end I did all the analytic processing in PostGIS and the presentation in QGIS. Accordingly I'm more interested than ever in the ideas of the guys at Mapsdata who I met a couple of weeks ago at a London OpenStreetMap gathering at the Blue Posts.

I hope the data speak for themselves. Very incomplete mapping in Wales, the South-West Peninsula, and Lincolnshire are no surprise, but I didn't expect the pretty good data in most areas of the Scottish Highlands. I suspect that much of this may down to the activities of a single mapper. A number of areas have more postboxes than recorded by Royal Mail in 2009: this may be redundant entries in OSM, single entries for post-box pairs in the Royal Mail data, or changes in the number of postboxes between 2009 and 2013.

Even in areas we know to be fairly well covered by on-the-ground mapping, coverage is patchy. I can only conclude that some mappers DO NOT MAP POSTBOXES.

Monday, 28 February 2011

Frustrated in Oakham

Mill Street, Oakham
I visit Oakham about twice a year, and on my last couple of visits have done a bit of ad hoc mapping. The town, like the rest of the county of Rutland, was largely mapped many many years ago over one weekend by the Rutland Mapping party. It has received only a little attention since.

When I visit the Rutland Bird Fair I usually travel by bus, so the first thing I ever noticed about Oakham on OSM was that it was missing the road off the main street to the bus terminus. I was eventually able to fix this during the 2009 Bird Fair. I made a few other corrections, but also added an 'e' to Catmos Street, which provoked comment on talk-gb. (In my defence, OSM had Uppingham Road as Catmos Street for 3 years). Last year I added the Tescos car park and a couple of shopping arcades.

IMG_2229bOn Wednesday, I thought I'd sneak off and clean-up some mis-matches between OSM data and OS Locator. More or less as soon as we arrived I noted an unrecorded footpath, and then a small residential road opposite the library. This is the problem with Oakham, superficially it looks to be mapped in detail. In practice, there are still plenty of significant features missing. For instance, there are loads of 20 mph speed limits around schools (e.g., on Kilburn Road, Ashwell Road and Braunston Road).

Furthermore, most mapping is now four and a half years old, and Oakham is changing. The most obvious change is a huge construction site on the Barleythorpe Road: the Catmose Campus which will house a sports centre, and new buildings for the main secondary school in the area. I walked past it in the rain (photo below): apparently the school may move in next Monday (a bit optimistic I'd have said). However, if the last couple of years are anything to go by, this dramatic addition won't get mapped in detail for a while.

Catmose Campus : 2192a

Other changes are impending: Sainsbury's just had a planning application for a supermarket turned down, and Waitrose have one pending. In the summer there was a for sale sign over the Agricultural Showground suggesting that it has been 
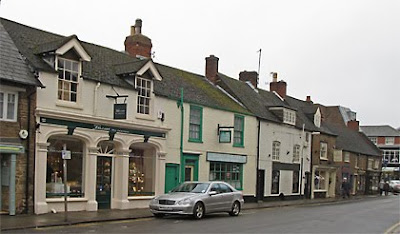
zoned for housing. Even the shops on Mill Street which I've mapped show many changes from the same street a year or two ago as can be seen by looking at Google StreetView.

There are other issues with the mapping: both tagging and mapping practice have changed since 2006. Most GPS data is probably more accurate, and of course we have aerial photos, and OS data as well.

BUT, most of all, what we lack,is someone based locally. Someone aware of what is happening in the community, such as this interestingly acrimonious planning meeting. Someone able to pop down to the library or the study centre in the Rutland County Museum to check old maps or other sources for names; Someone who knows whether the sixth-form college is called "The Rutland College" or "Rutland County College", and , indeed, what's going to happen to it if Waitrose build a supermarket on its current site; Someone who can act as an advocate for OSM with groups like the formidably active local history society. Surely if someone is willing to compile a list of bells, clocks, scratch dials for Rutland, there might be one person interested in something as mainstream as contributing to a map. This is not just true for Oakham and Rutland, but for many places in Great Britain.

Not for the first time I wondered if a mapping party, consisting mainly of visitors, might have the same effect as an import. The town looks nicely mapped on the slippy map, so no-one notices that there's lots to check and correct: indeed if I regularly drove to Oakham I might not have noticed these deficiencies in the first place. I collected data in the rain with these doubts in mind. I'll map what I can, there is far more which needs to be checked, corrected, and enhanced than anyone can collect in a fleeting visit.