Showing posts with label Analytics. Show all posts

Wednesday, 25 July 2018

Coda on shop completion rates on OSM

Thanks to John Baker (Rovastar) for a few suggestions discussing my recent blog post in the pub last night:

  • What do the graphs of numbers of unique shop tags look like with heavier filtering of relatively poorly used tags.
  • E-cigarette shops are a recent phenomenon, and should represent a genuinely novel tag rather than the mix of typos, synonyms etc which characterise much of the long tail of shop tags.

These were easy to follow up, so I present the graphs here:

Unique shop tags over time on OpenStreetMap for Great Britain,
filtered to remove tags with a restricted number of uses as at June 2017.
For virtually any level of filtering the curves level out around 2010-2011. Thus the core set of shop tags looks to be very stable. A good place to judge the extent of likely synonymy for shops in Britain is the LUA script used by SomeoneElse for his "Useful Maps".

Growth of mapped e-cigarette shops in GB on OSM
As expected e-cigarette shops first appeared rather late, at the end of 2013, and there are a decent number mapped (over 200 by mid 2017). I haven't checked, but I suspect the sharp increase in 2017 was caused by some tagging rationalisation. It's not unusal for new things to acquire a range of synonyms before tagging stabilises and one value becomes favoured. (It's equally true that in some cases this does not happen).

I've had a couple of other requests which it will take rather longer to look at, but if you have ideas relating to shops in Great Britain I can look at the data right now.

Tuesday, 24 July 2018

Can we identify 'completeness' of OpenStreetMap features from the data?

At the Milan SotM conference Stefan Keller from the Geometalab at HSR (Rapperswil) will talk about recent work of his group on identifying "Areas of Interest" (AoI) from OpenStreetMap data. Stefan has been kind enough to involve me in some discussions about this work as it has progressed, but in this post I am solely concerned with a separate issue arising from the use of points of interest in this work.

Growth of shops mapped on OSM for selected Local Authorities
(See Analysis section below for commentary)


Areas of Interest were introduced on Google Maps back in 2016. Loosely they correspond to shopping, entertainment and cultural areas with large clusters of relevant points of interest. No doubt Google not only used map features, but also other sources of data such as location of Android phones to calculate the footprints for Areas of Interest (shown in a pale orange or salmon colour on Google Maps).

There are issues with the Google implementation, some discussed in this CityLab article from 2016. My own examination of Google Maps confirms that shopping areas which are otherwise equivalent in range and type of shops are chosen as AoI in wealthy areas, but not in poorer areas dominated by social housing. I also found some places, notably the UBS IT centre in Altstetten, Zurich, which have erroneously been identified as AoI by Google. The work of Geometalab is therefore interesting not just in terms of whether OSM data can be used to calculate similar areas, but also to provide suitable data where biases based on socioeconomic status can, at least, be identified and corrected because data and code are open.

Zurich, centre and Aussersihl districts, showing Areas of Interest.
Work of Geometalab, derived from OpenStreetMap data.
The starting point for this type of work relies on areas where POI mapping density is high and reasonably complete (for instance, the areas of Switzerland which Stefan's group have looked at, and areas of the English East Midlands and Germany which I have looked at both recently, and in the past). Given that it is possible to calculate reasonable AoIs from OSM data where PoI density is high, the question arises "Can we identify which areas are 'reasonably' complete?". Normally, this type of work has involved comparing OSM data to some external reference data which are assumed for the purposes of comparison to be complete (for instance Peter Reed's work on UK retail). However, in many parts of the world, and for many topic domains there is no readily usable data for this purpose. So the ancillary clause for the question is ", and we do this with OSM data alone?"

This post is a first look at the problem for one class of POIs:  shops.


Friday, 1 July 2016

How far are Hedgehogs from a road?

My last hedgehog siting (2010)2887a
My last hedgehog sighting in Britain: Elston, Nottinghamshire 2010.


One of my great joys with OpenStreetMap (and other (mainly) geographical Open Data) is that it provides a way into answering intriguing analytical questions.

A few weeks ago the query was from a Hedgehog ecologist: naturally I learnt of the query through OSM (via IRC to be precise).

The question was very simple:  

What proportion of Britain's land area is more than 100 m from a road?  

The reason it is germane for hedgehogs is that historically they have had a very high mortality from crossing roads. These days they are so rare, that spotting a squashed hedgehog is itself a rarity. Certainly this cartoon would not have the same resonance it did when it first appeared in the 1970s.

To answer the query is fairly straightforward: providing one has either a GIS tool or database to hand AND a full data set of British roads. QGIS and PostGIS were available & I also have a full set of OSM data for May 2015 in the latter.


Thursday, 12 November 2015

Urban Areas 2 : Derivation from OpenStreetMap using Residential Roads

Street corner, Retiro, Buenos Aires
(Libertad/ Juncal)
CC-BY-SA, the author
Following on from my last post I have now been looking in more detail at how one might start using OpenStreetMap (OSM) to create a global dataset of Urban Areas. As OSM does not have any widely used notation for urban areas I have been looking at several ways in which other OSM data can be used to identify such areas prospectively. In this post I look at the use of residential roads (and I'm not the first to do so). Later posts will look at other techniques.

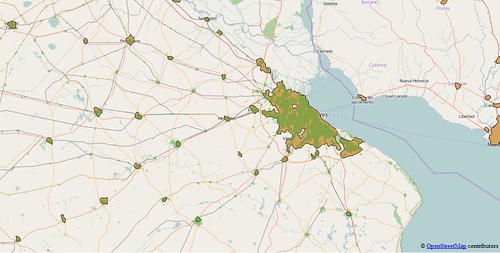
ar_ba_urban2
Buenos Aires and hinterland, showing comparison between urban polygons
derived from OSM (green) and the Natural Earth data (light brown).

I have chosen the following places as suitable test areas for these investigations:
  • East Midlands of England. Not only my home turf, but also a well-mapped area with extensive use of landuse tags, and in excess of 99% of all residential roads. In addition Ordnance Survey Meridian 2 Open Data contains a layer corresponding to urban areas which provides an excellent control for checking results from this area.
  • Pakistan. Not only one of the most populous countries in the world, but one of the least well mapped in OpenStreetMap. Pakistan is a likely candidate for cities which are barely mapped. I would also expect other very populous Asian countries (notably China, India and Bangladesh) which are poorly mapped to be similar to Pakistan.
  • Nigeria. Similar criteria to Pakistan: the most populous country in Africa. The .pbf file for Nigeria is approximately 50% larger than that for Pakistan, but both are smaller than that for Lesotho with a population of 2 million compared to 180 million (Nigeria) and 200 million (Pakistan).
  • Côte d'Ivoire. Close to Nigeria, but a place which I know has an active OSM community. Quite a number of mapping activities. (Note to Geofabrik, it's not called the Ivory Coast any more).
  • Argentina. Latin American cities are often laid out in a grid, nowhere more so than in Argentina. The prevalence of the grid system, and my believe that the urban road system is largely complete were reasons for choosing this as a Latin American example. My own experience of travelling in Argentina after SotM-14 suggests that, for the most part, urban road systems are mapped. One known gap, the newer western suburbs of Ushuaia has recently been rectified by the kind provision of aerial imagery from the Argentine National mapping agency.
  • Pennsylvania. It was essential to include some US data  because of the TIGER import problem: all rural roads being tagged residential. Since I spent part of my childhood in Pennsylvania it is also a place I know and which I have edited (sporadically) to improve the rural road network.
Briefly I expected the following: good urban areas for the East Midlands and Argentina (i.e., better than Natural Earth (NE)); middling to poor for the three developing nations (gaps relative to NE, but in some cases better precision); hopeless for Pennsylvania.

Sunday, 25 October 2015

Urban Areas: a meditation on why simple global geographical datasets are so poor

Puerto-Vallarta
Puerto Vallarta, an aerial view of an urban area missing many roads on OpenStreetMap.
The area in the middle distance away from the sea was particularly lacking.
Fortunately the centre of the hurricane didn't pass over this area.
Source: Wikimedia Commons, (c) CC-BY-SA


The other night, as Hurricane 'Patricia' bore down on the Pacific coast of Mexico, I had a twitter conversation with Bill Morris and others regarding how well mapped Puerto Vallarta was on OpenStreetMap. (BTW: I'm sure it's much better mapped now).
Of course, OSM is about fixing things, so I carried out the conversation in between adding around a hundred streets to the city. However the really interesting question was this one:

Whilst at breakfast I thought a little more about this. I decided it ought to be possible to do something fairly simple with data which already exists.