Showing posts with label ordnance survey. Show all posts

Sunday, 15 January 2023

A little surprise hidden in OS Terrain50 open elevation data

The reporting and discussion of a mountain rescue on the the minor Lakeland peak of Barf continues to generate a mass of things to investigate and follow-up. I've already written two OSM diary entries on assigning slope angle to paths because of it: here and here.

To recap, recently the Keswick Mountain Rescue were called out to help 3 people who were stuck ("cragfast") on steep ground on Barf. They didn't feel confident to retrace their steps back down very steep (30 degrees or over) scree and had reached a small crag with no obvious visible route through it. They had been using one of the mobile phone outdoor hiking apps which uses OpenStreetMap data for suggesting walks.

The event was reported in the national press (The Guardian) and, of most relevance, by a specialist magazine, The Great Outdoors. The latter did a great job of thoroughly researching a news article, getting comments from the OpenStreetMap Foundation. Their specialist advisor Alex Roddie decided to publish the content of his initial response to Carey Davies, the author of the article. Both articles are well worth reading for an in-depth initial response to the situation and the issues arising. There have also been lively exchanges both on Twitter and Mastodon, again containing useful comments from people with a lot of experience of the outdoor scene in the UK.

I won't comment here on the whys and wherefores of what kinds of paths and hiking routes should get mapped on OSM. The subject is complicated enough in Great Britain as all this discussion shows. One of the side distractions this did prompt for me was looking at how we could show contour data for OSM in the British Isles (and specifically on Andy Townsend's rural hiking map).

A toot by Nigel Parish did highlight that typically maps based on OpenStreetMap have contours which are greatly smoothed compared with the actual terrain. His example was from Andy Allan's Thunderforest Outdoor style which is incorporated into a number of hiking apps. Like most regular OSM contributors, I'm used to OSM-based maps using SRTM data to create contours: both because it's free and because it has more-or-less worldwide coverage. However, we are also aware of the deficiencies of this data: it has a relatively low resolution of around 1 second of arc (so roughly 30 metres resolution) which smooths contour lines and hillshade overlays.

I had recently downloaded the Ordnance Survey's own open data elevation model Terrain50, which I used for the first of my diary entries. This has a grid interval of 50 m, so although undoubtedly more accurate than SRTM, it is of somewhat lower resolution. I therefore expected contours generated from the DTM to be comparable with those of SRTM.

I'd forgotten that I'd used the vector dataset, so my first step was to generate contours from the raster tiles provided by Terrain50.


Barf with contours derived from the raster DTM of Terrain50.

After I'd done this, I remembered that the Geopackage was easy to use, so I added that. To my surprise the contours had rather more detail than those derived from ostensibly the same dataset.

With contours from Terrain50 vector data

Lastly, I created 10 m contours from the 1m Lidar data available from the Environment Agency for NW22NW. This, as expected shown both high resolution and accuracy.


With 10m contours derived from Environment Agency 1m Lidar.

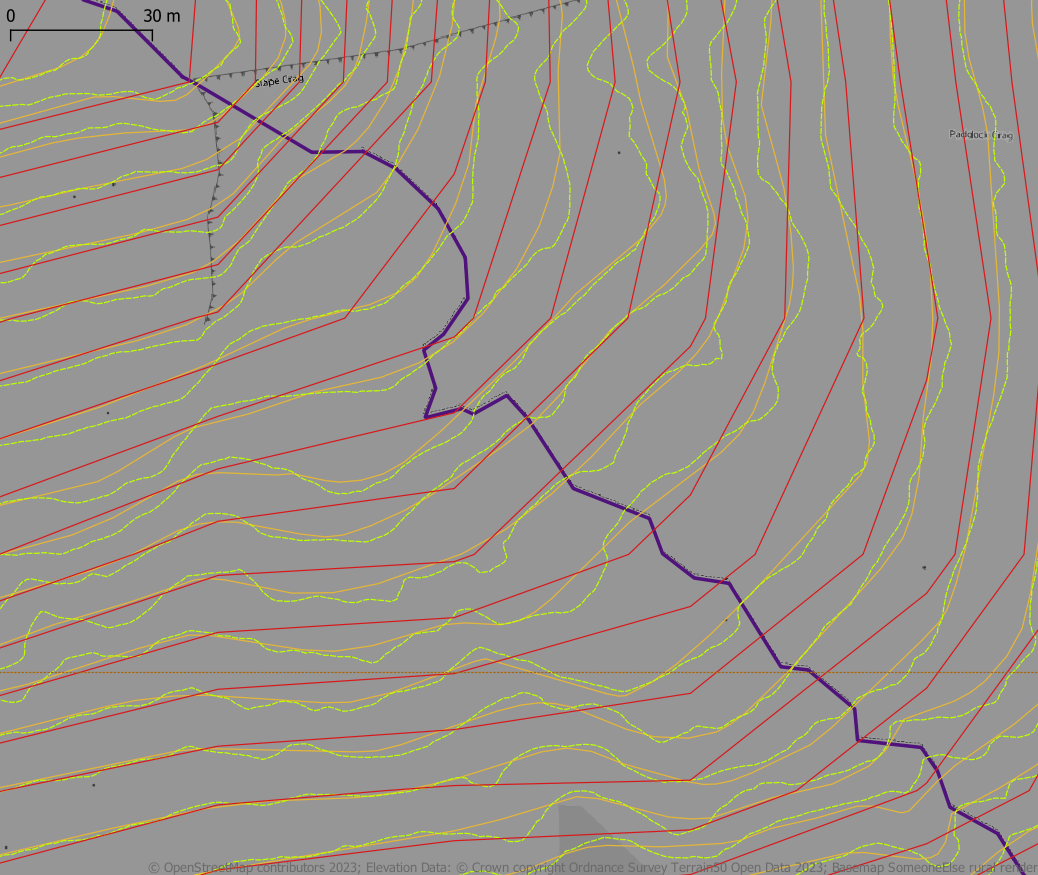
To compare the three types of 10 m contours I changed colours and their background. Here are all three at a scale of 1:1000 on the steep SW slope of Barf between the Bishop of Barf and the crag which balks some walkers. In the image below it can be seen that the vector Terrain50 data is of much higher resolution than the raster data from the same source. In most places vector Terrain50 data is much closer in alignment with the contours derived from 1m Lidar data. As Nigel pointed out the more detailed contours give a significantly different impression of the shape of the hillside.

All three types of contours shown together. Red derived from OS Terrain50 raster; Orange: OS Terrain50 vector; and Green derived from Environment Agency 1m Lidar DTM. Scale 1:1000.

Nigel also pointed out that lots of relevant terrain features, shown on printed maps (Harvey & OS), and available as online tiles, were missing. This type of detail is often difficult to generate automatically using software, and even then is unlikely to match the output of skilled draughtsman working to detailed composition rules. I tried adding a hillshade layer from EA data, but it didn't really pick out this detail. Then I remembered that Luke Smith of Grough had used a layer provided with OS VectorMap District called "Ornament" when he prototyped maps based on open data. I therefore added this layer. It works quite well at low zooms, but is rather ugly at anything higher than 1:5000.

Added hillshade from Environment Agency data and Ornament from OS VectorMap District open data.
Hillshade is less effective than I expected at high zooms, and the ornaments only really work in a range 1:5k (as here) to 1;25k or thereabouts.

Lastly, and more for fun than anything else, I regenerated contours at 15 m intervals and clipped these by scree layers mapped on OpenStreetMap and changed the colour of the contours to a shade of grey to replicate how this information is shown on the Harvey Map. The end result is a good illustration of these differences: the Harvey Map generalises features such as cliffs and places them to enhance the map users' impression of the terrain, whereas the OS ornament looks nice, but is nothing like as good a guide for the walker.

With 15 m contours (from EA 1m DTM) and with contours on scree coloured grey rather than brown (as done by Harvey Maps), plus OS VMD ornament.


The bottom line from this is quite simple: don't bother with Environment Agency Lidar data if you just want contours: Terrain50 vector data is much easier to get up and running. The data is also packaged as mbtiles, but I couldn't find a way to style this in QGIS.

Lastly a big thank you to Nigel Parrish who caused to to look at the data, and thus discover the difference between the vector & raster versions.


Friday, 1 July 2016

How far are Hedgehogs from a road?

My last hedgehog siting (2010)2887a
My last hedgehog sighting in Britain: Elston, Nottinghamshire 2010.


One of my great joys with OpenStreetMap (and other (mainly) geographical Open Data) is that it provides a way into answering intriguing analytical questions.

A few weeks ago the query was from a Hedgehog ecologist: naturally I learnt of the query through OSM (via IRC to be precise).

The question was very simple:  

What proportion of Britain's land area is more than 100 m from a road?  

The reason it is germane for hedgehogs is that historically they have had a very high mortality from crossing roads. These days they are so rare, that spotting a squashed hedgehog is itself a rarity. Certainly this cartoon would not have the same resonance it did when it first appeared in the 1970s.

To answer the query is fairly straightforward: providing one has either a GIS tool or database to hand AND a full data set of British roads. QGIS and PostGIS were available & I also have a full set of OSM data for May 2015 in the latter.


Monday, 18 January 2016

UK Open Data and Buildings in OpenStreetMap

I've finally (after 8 months) got around to looking at the OpenMap Local buildings. This new dataset was launched at the first OpenDataCamp, and I've had the SU 100 kilometre square data on the PC since then (it's contains Southampton, where Ordnance Survey are based). I use Meridian 2 OS Open Data regularly and extensively, but these days don't make much use of the larger scale vector data.
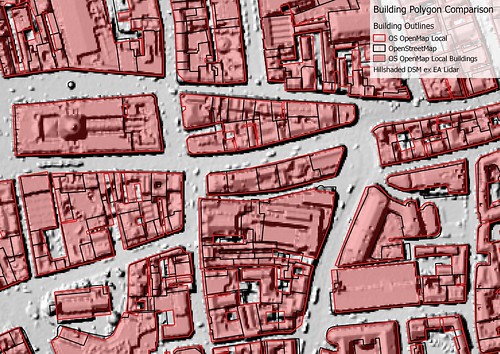
Nottingham City Centre: OSM/OSGB Building Comparison
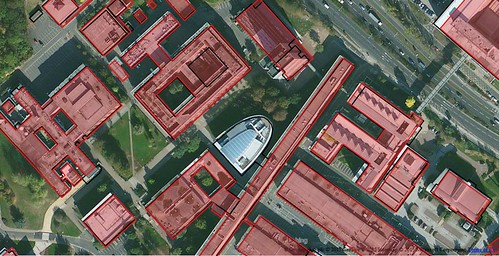
Comparison of Building polygons for Central Nottingham
OSM has more detail and does not merge discrete buildings.
Contains Ordnance Survey data (c) copyright and database right 2015, OSM data (c) OpenStreetMap contributors 2015, Lidar data from Environemnt Agency under OGL 3.0, (c) Crown Copyright and database right 2015. Image CC-BY-SA, the author.
I needed them for something else which caused me to download the SK data. Co-incidentally Christian Ledermann had asked on talk-gb about using this data to add buildings to OpenStreetMap for Newark-on-Trent. A little earlier the Environment Agency had released Lidar data for England, and this is also useful as input for mapping buildings.

OpenMap Local

Apart from the area I originally needed which were in SK41 (no buildings in OSM), I've also looked at areas which I know much better & compared some selected areas where we have good building coverage around Nottingham. The comparisons I made are shown visually, with my main observations summarised at the end. Note that comparisons have not been made on any systematic basis.
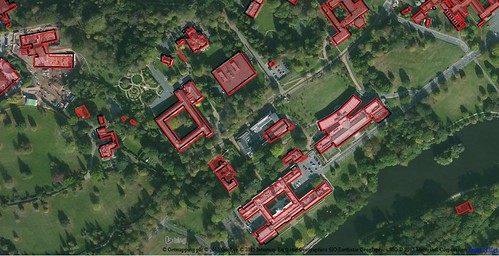
uon_univertiy_park
University Park, University of Nottingham
an area of predominantly large academic buildings.
OpenStreetMap and OS OpenMap are largely in agreement: the minor differences applying to newer buildings which post-date the Bing imagery.
Contains Ordnance Survey data (c) copyright and database right 2015, OSM data (c) OpenStreetMap contributors 2015, Lidar data from Environemnt Agency under OGL 3.0, (c) Crown Copyright and database right 2015. Aerial Imagery via Bing, (c) as in image. Image CC-BY-SA, the author.

uon_science_city_buildings
The Science City part of the University Park campus.
A new large lecture theatre block is not present in OpenMap data, and the outline of the building top centre (Tower Building) is over-simplified.
Contains Ordnance Survey data (c) copyright and database right 2015, OSM data (c) OpenStreetMap contributors 2015, Lidar data from Environemnt Agency under OGL 3.0, (c) Crown Copyright and database right 2015. Image CC-BY-SA, the author.


newark_buildings2
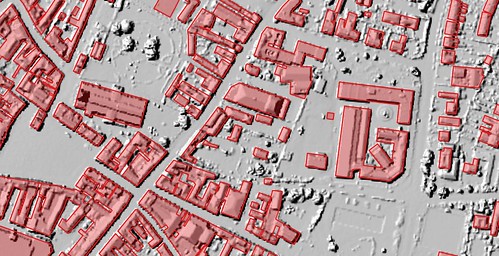
Central Newark. OpenMap vs Lidar.
Many instances of building merging & over-simplification are apparent here, notably with the outline of the parish church.
Contains Ordnance Survey data (c) copyright and database right 2015, Lidar data from Environemnt Agency under OGL 3.0, (c) Crown Copyright and database right 2015. Image CC-BY-SA, the author.

newark_buildings1
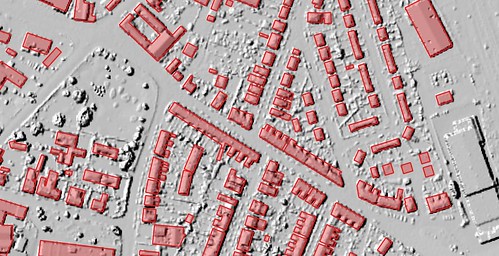
Newark-on-Trent, residential areas, Showing inconistency in size for similar houses, and merging of terraced housing.
Contains Ordnance Survey data (c) copyright and database right 2015, OSM data (c) OpenStreetMap contributors 2015, Lidar data from Environemnt Agency under OGL 3.0, (c) Crown Copyright and database right 2015. Image CC-BY-SA, the author.
I have not made systematic comparisons, but these are my main observations (in brackets the 1km grid square where I've noted any particular issue):
  • Best for larger buildings. The data seem much more reliable (actually matching building footprints fairly well) for larger buildings. Even for large detached houses I would regard the data as unreliable: on our road of 40 detached houses, at least 16 are represented as terraces (SK5439). Similar artefacts occur in other areas with detached houses: apparently caused when a garage is close to both houses. Smaller houses are inherently simplified: no better than drawing one in JOSM and then copying the outline in fact.
  • Building fusion. This is particularly clearly seen in the city centre image, where a whole block of buildings has been simplified to a single building (centre of image), but also occurs in suburban housing (see above).
  • Inconsistency in geometry simplification. This is most noticeable in the city centre. (SK5739). For instance compare the OSM and the OpenMap Local outlines for St Peter's Church (bottom right in map above). In OpenMap Local the church is just shown as a rectangle, whereas in practice it is more complex. Modern buildings on the Jubilee Campus of Nottingham University are generally shown with more detail.
  • Inconsistency in building size. In SK5439 there are a very large number of houses which were identical when built. However, in the OpenMap Local they are often of different sizes. (This is also probably true of OSM, if buildings have not been created by duplication).
  • Voids. Gaps between closely packed buildings in the city centre appear slightly arbitrary in both placing and whether such a void exists or not.
  • Some selection inconsistency with small size buildings. Only 2 garages are shown in an area of around 500 houses. With OSM the figure is nearer 200+. (SK5439)
  • Demolished buildings. Whilst I would not expect the data to show the building demolished in the past month, I would expect it to not show one demolished 2 years ago, and I would certainly expect it not to show one demolished in 1970 (although MasterMap shows this too). (SK5439)
  • Better locational accuracy. If using the full transform it may be useful to take advantage of the better locational accuracy of this data. In the main OSM buildings are rarely more than 3 m displaced from the OS OpenMap Local. (SK5439) In general the more recently mapped buildings in Nottingham city centre have better locational accuracy than this (SK5739).
Taken together, my use of this directly within OSM would be along the following lines :
  • Selective transfer of larger buildings (schools, offices, public buildings, factories, warehouses, larger shops) on a case-by-case basis from a shapefile to a JOSM editing layer, or to Potlatch 2. Some minor refinement will probably be needed (for instance a university building here has long narrow courtyards which act as light wells which are not shown in OpenMap Local.
  • Only use it for houses and similar when shapes are very simple and everything has been double checked, at the very least, against aerial imagery. For simple shapes it's as quick to draw & copy in JOSM anyway. A similar principle holds for more complex building shapes on modern estates, where one building can be cloned.
  • Watch out for demolished buildings. This requires not just checking against Bing/MapBox imagery, but some local knowledge for sense checking.

Environment Agency Lidar Data

Another source of building data is the recently released Environment Agency Lidar data. This does not cover the whole country, and in many places may only be at 1 or 2 m resolution. It may also be quite old. However, because it does not suffer from parallax artefacts it can be used in conjunction with both aerial imagery (whether from Bing, MapBox or more local sources) and OS OpenData. I have provided examples from Nottingham, Newark, and Melton Mowbray of this data, combined with one or more of OSM buildings data, OS OpenMap or Bing aerial imagery.

Melton Mowbray. EA Lidar DSM (1m) overlaid on OSM.
The Lidar data was used to refine the OSM building outlines
which originally were traced from OS StreetView as block-sized polygons.
(see commentary)
Melton Mowbray illustrates many of the benefits of Lidar data. It is a fairly typical country town, with many of the buildings in the town centre ranging in age from 10 to 500 years old. Many extend back from the street in a series of outbuildings (e.g., stables) which have eventually been incorporated into the main building, but this process leaves lots of small courtyards, service yards, etc which are more or less impossible to discern on aerial imagery.
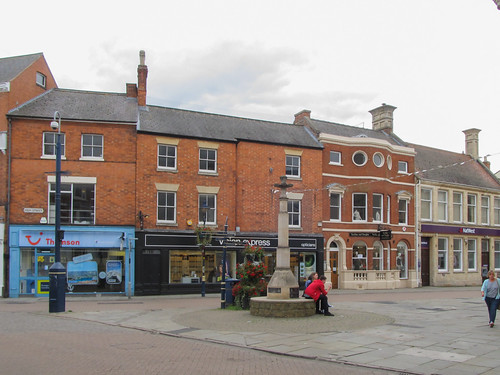
Butter Cross on Market Place, Melton Mowbray
Butter Cross in Market Place, Melton Mowbray
Despite the different styles & ages of the buildings, several have long ranges at the rear.
By doing a street-level ground survey one can identify which buildings are distinct on the street front. Lidar than helps to construct a building outline which is consistent with this. I surveyed the cetre of Melton in September, and this was the first place where I used Lidar data to aid in the interpretation of aerial imagery. In this case I find it essential to have adequate street level pictures to be able to relate to the aerial imagery: most useful are the presence and distribution of chimneys: because they throw shadows they are often visible even on poor quality imagery.

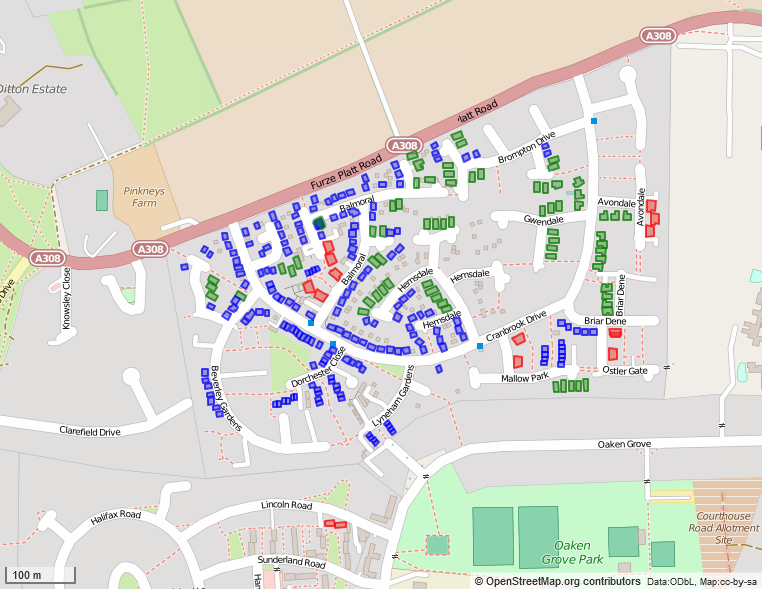
The Lidar data also allows one to do some other things: notably find building heights. I've done this for a 1980's estate on the edge of Maidenhead: particularly easy as the residential buildings fall into a small number of categories: bungalows, two-storey-houses & maisonettes (purpose built flats in a house-like structure.

A 1980s housing estate with building heights mapped from English Environment Agency LIDAR Open Data. Buildings fall into 3 height categories: bungalows (green: approx 4m high), 2-storey houses of various kinds (blue: approx 6 m high), and maisonettes (condominiums) which are about 7 m high (red). Heights were calculated in m, so the values represent minimum heights of the highest part of the building, which is nearly always the gable line.
Outpur via Overpass Turbo, styled with MapCSS.
There are many other useful blog posts about using this Lidar data, both specifically for OSM, but also generally. See posts by Chris Hill ("More Lidar Goodness" and "Building Heights") and Ed Loach for some of the specifics, and the write-up on the wiki. A nice post and map (v. slow in my browser) showing building heights in London on OpenMap Local may also be of interest. HousePrices has processed all the Lidar data from EA and Natural Resources Wales  as a hillshaded slippy map which is useful to look at what is available. Slightly unfortunately the map is in OSGB projection (ESPG:27700) and is not shown with other slippy maps which would make it a bit easier to locate oneself.

What kind of building data should be added to OSM?

From past experience single building outlines traced from OS StreetView, turn out to represent tens of buildings on the ground. Such simplified outlines just makes the work of splitting the buildings properly quite a lot harder. This can be particularly bad in town/city centres.

Usually if adding detail of POIs and addresses it is important to have individual buildings mapped: this makes it much easier to correlate photos to roofline features such as chimneys, gables etc. A single very simple outline may be OK, because for more detailed mapping it should just be a question of deleting the original outline. However, the question must be asked, as to what purpose such an outline fulfils on OSM, when the source data can be readily combined with OSM data for downstream consumption.
Granby Street, Leicester (geograph 2296099)
Granby Street, Leicester.
The multiple buildings shown here are represented in OSM as single buildings for each block
(imported from OS StreetView Open Data).
CC-BY-SA   © Copyright Malc McDonald and licensed for reuse under this Creative Commons Licence.
I think the fundamental question about straight imports into OpenStreetMap should be "Will it make life easier or harder for subsequent mappers?".

If the work involved refining a building outline takes longer than re-drawing the building then I doubt if its worth importing the building at all. This is particularly true if the outline is actually of multiple buildings. This is why large building outlines are most valuable: they are generally pretty good compared with what an initial hand-traced outline might look like, and they lend themselves better to stepwise refinement. One group of buildings I find particularly tedious to do well are schools which tend to be a sprawling mass of interconnected buildings. Starting with a decent polygon with orthogonalised angles make adding such detail much easier. The current quarterly project for UK-based mappers might be the time to test this.

Of course it may be that adding buildings assists in some other mapping goal. I've already mentioned that details of buildings are very useful for addresses. However OpenMap Local lacks the detail in precisely the areas where it would be most useful (city & town centres). For suburban or inner-city housing similar polygons can be created as quickly in OSM editors (notably in JOSM, by duplicating existing buildings or using the Terracer (or even UberTerracer) plugins.

The other thing which many people want is rendered maps largely derived from OSM, but showing more buildings. In practice, because many mappers do not have the know-how, wherewithal or time to create such a rendered view, they tend to want to import buildings. Historically, OSM tools for importing data are often much easier to use than ways to incorporate the same data and OSM data to  render maps and make them accessible on the web. Perhaps we need to do more to help people in the latter task: which is now getting more complicated again with the move to vector tiles (at least outwith use of MapBox Studio), and TileMill's effective status of being a legacy application.

Summary 

Sadly, although the new building outlines are better than what preceded them, in most cases they don't offer a decent route for iterative refinement with OpenStreetMap.

This absence of a simple way to improve building outlines means that ideally people wishing to use this data would merge it with OSM data outside of OSM. I do recognise this is often too much work, or too big a learning curve for many, and consequently there will always be a desire to add buildings to OSM because many people are much more comfortable with consuming only OSM data for their purposes.

Existing tools for drawing buildings in OSM are pretty powerful & getting more powerful all the time. Many of us, and I include myself in this group, are unaware of the full extent of these utilities. See bdiscoe's diary post about mass adjustment of circular buildings (huts) for some insights.

Tuesday, 2 September 2014

Woodland Cartography

This is an expanded version of my talk at sotm-eu:


I start by seeking inspiration from the many ways in which woods and trees have been shown on maps in the past, and then consider what elements we may want for OSM data, and how we might depict such elements.

Thursday, 31 October 2013

Not very INSPIREd: Land Registry 'Open' Data

Many OpenStreetMap contributors have been very excited about the potential for importing address information from data sets released under the European Union's INSPIRE directive. Our experience in the UK tends to make us more cautious in our expectations, and so it proved with the latest release of Open Government Data under this programme.

Comparison of Land Registry parcels with gardens on OSM in Sutton Coldfield
Scatter plot with log-log scale.
Firstly, (another) quick word about the complexities of organisation of cadastral data in the UK. There are separate cadastral agencies for each of England and Wales, Scotland, and Northern Ireland (note the Oxford comma), which run in different ways: not least because the legal framework of Scot's Law is quite different from English Law. Thus the data released only relates to England and Wales.


Friday, 14 January 2011

How good is MasterMap?

I've been reflecting on the buildings which have recently been demolished on the Edwards Lane Estate. Both Rosecroft Court and Hayward School still appear on the Ordnance Survey MasterMap available at Nottingham City Council's Nomad site. Now I don't know how frequently this data is refreshed, so it may be that the council only update occasionally.


I thought I'd look a bit closer to home, and selected this little bounding box shown above in aerial photos Bing from 2008 (slightly earlier aerial photos from Google here). I'd like to show the actual MasterMap data, but I suspect that posting on a blog is well outside "for private use".

Anyway within this bounding box I can find the following inaccuracies compared to what is on the ground, with a planning application reference when its been easy to find it quickly:
  1. Pavilion on playing field, Jubilee Campus. Originally built as changing rooms for Cottesmore School, for the past 10 years this was used as a storage facility by the Estates department of the university. Demolished in 2009.
  2. Cycleway on playing field, Jubilee Campus. Installed during 2009 to reflect the brutal reality that this was the route the vast majority of cyclists and pedestrians used, rather tahn the longer path to the west.
  3. Large garage, Lenton Lodge. Built around 1995-6 (95/00584/PFUL3).
  4. Former Police Station, Charnock Walk. Demolished sometime during the 1970s.
  5. Grass area in front of Lenton Lodge. Fenced in around 1977, when the Lodge ceased to be used as tied accomodation for workers in the council Parks department.
  6. Former Ladies toilet, including access, in south wing of Lenton Lodge. Closed in the '70s either on, or before, change of use for the lodge.
  7. 17, Wollaton Hall Drive, Extension built to rear (91/10013/PFUL3)
  8. 18, Wollaton Hall Drive. Extension built to the east of the house, perhaps 20 years ago.
  9. 20, Wollaton Hall Drive. Extension to rear.
  10. 22, Wollaton Hall Drive. Extension to rear. (92/01923/PFUL3)
  11. 49, Charnock Avenue, Large extension built to rear.
  12. 51, Charnock Avenue, Two extensions built, last in 2010.
Note that these are just the obvious ones culled from memory, with one or two checked against the planning applications site. If I went and specifically surveyed for them (and used Bing, the council site etc.,) I'd expect to double the size of this list.

There is a high degree of change, which is, no doubt, a reflection of the area.

In the past 15 years many houses in a whole swathe of the city have been bought by private landlords for renting to students. Larger houses are also attractive to extended families with couples of two or more generations living in the same property (both often identifiable by the presence of large numbers of cars, and most of the front garden given over to parking).

The same phenomenon of change is, however, true of the Dales Estate in Sherwood, which I surveyed earlier in the week. My impression was that this area is still owner-occupied by single-family units, but there are many obvious extensions, and quite a bit of building activity happening right now. In contrast, the houses on the Edwards Lane Estate (last week's survey target) mainly have their original appearance. Many are no doubt still social housing (plenty of Nottingham City Homes vans in evidence), but there were a few "For Sale" signs indicating some owner-occupation. It would be interesting to see if similar inaccuracies apply to these areas.

The Ordnance Survey makes much of the speed, frequency and precision of MasterMap updates. However this cursory look suggests that there side of the story is partial at least. I'm sure there is much I have missed, but hese are the implications which I can see initially:
  • By drawing building outlines, from up-to-date aerial imagery, OSM can offer more accurate information than the OS, although we will never achieve their precision. Note, how much the trade-off between information currency and precision is reflected here (maps "good enough" for their purpose).
  • Planning applicants are required to submit MasterMap output with their applications, and the derived fee income must form be a significant part of the OS revenue: I would guess a few million quid. The OS is a monopoly provider and has no incentive to keep this information up to date for its captive market.
  • Councils raise revenue through council tax on domestic properties. Inaccurate information on the size of properties could affect the accuracy of rating valuations.
  • Property size, gardens converted into parking areas, and so forth have other effects. The most obvious is increasing the direct run-off from rainfall. It is known that this has affected the hydrography of many parts of England (although changed farming practice may be much more significant), with consequences for storm drainage and flood defence. Again, failure to track change may result in under-estimation of any ensuing problems.