 |
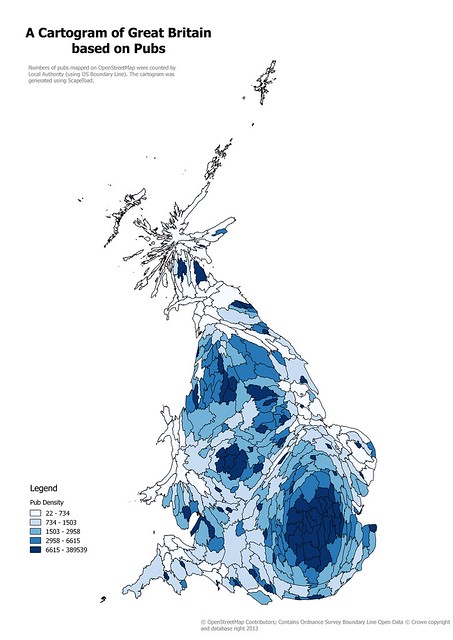
| Cartogram of Local Authority areas in Great Britain based on numbers of pubs on OpenStreetMap Created using ScapeToad, this is a simple, and naive, cartogram. |
Showing posts with label Cartogram. Show all posts
Showing posts with label Cartogram. Show all posts
Tuesday, 19 May 2015
Retail Outlets on OpenStreetMap: Cartograms, and Patchwork Quilts
I enjoyed the process of creating a cartogram from OpenStreetMap data a couple of years back, even if it was somewhat tedious. However two things stopped me from taking it further: the QGIS plugin I was using does not work with later editions, and I really wanted something a little more refined.

Thursday, 27 June 2013
Cartograms and OpenStreet Map Data
 |
| OpenStreetMap data distorted using a gridded cartogram based on Voronoi polygons from pub centroid locations. Rendered with Maperitive. |
 |
| The original OpenStreetMap data for the same area with Mapnik rendering. |
 |
| Cartogram of Parliamentary Constituencies in the United Kingdom around 1960 from Reader's Digest Complete Atlas of Britain and Ireland (1965) p. 133. Source: Unkee E. on Flickr. |
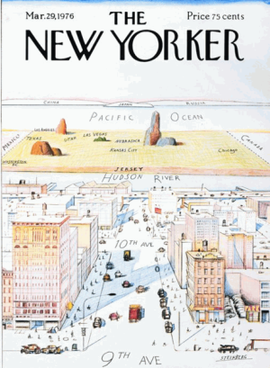 |
| View of USA from 9th Avenue, a well-known New Yorker cover cartoon. Source: Wikimedia. |
My first step was to create Voronoi polygons from the nodes representing the pubs. This is a simple operation available in Quantum GIS. In this way every part of the area under consideration was assigned to a single pub. by assigning an arbitrary area constant to each polygon and using this as the driver of the cartogram plugin it is very easy to produce a basic cartogram.
 |
| Voronoi polygons for pubs in central Nottingham. The outline of the road network is shown to provide a little context. |
However, my main goal was to distort ALL the underlying OpenStreetMap data in line with the cartogram distortion. To do this I overlaid a regular grid of squares 200 m on the side over the pub Voronoi polygons. These grid squares were then merged with the pub polygons so that each polygon was split into many smaller ones. An arbitrary area value was calculated for each (as a percentage of the original pub polygon) and scaled so no value was less than 1 (to avoid the plugin crashing). Once again a cartogram was produced, but this time a number of the vertices had known starting co-ordinates arranged in a regular fashion. Each smaller polygon was uniquely identified by a compound key made from the pub polygon and the original grid square.
 |
| Gridded Voronoi polygons as above, but with a 200m square grid added. |
 |
| The basic cartogram derived from the gridded Voronoi polygons above. Shading indicates all polygons corresponding to an individual pub. |
Finally I extracted the (distorted) data from my snapshot schema and stored it in the OSM XML format. To render the modified data I used Maperitive which is pretty much perfect for this purpose. The final result is shown at the head of this blog entry.
I leave it as an exercise for the reader to find any useful purpose for this process!
Subscribe to:
Posts (Atom)

