Showing posts with label Food Hygiene Scheme. Show all posts

Monday, 24 October 2016

Using Open Data for Statistical Purposes

A tweet by Owen Boswarva drew my attention to a recent report by Public Health England (PHE) on the correlation of density of fast food outlets and deprivation.

Number of Fast Food outlets normalised to 100,000 population for Local Authorities in England
Source: Food Hygiene Rating Scheme (Takeaway class)
Specifically my interest was directed at the source of fast food outlet counts. PHE used data from PointX, a joint venture of Landmark Information and the Ordnance Survey. I instantlly wondered if one could do the same thing with Food Hygiene Ratings (FHRS) open data. This is a quick report on doing exactly that.

I already had a complete set of FHRS data for September 2016. I needed to download various administrative and census geographies, population figures for Lower Layer Super Output Areas (LSOAs), Index of Multiple Deprivation (IMD) Scores for LSOAs and various files showing the linkages between the geographies.

A certain amount of data wrangling was needed to merge this data (for instance linkages, population and IMD) all came in spreadsheets with awkward column names, multiple sheets and other minor inconveniences. Once these were sorted out I had a table with base figures at LSOA level which could be readily aggregated to Middle Layer Super Output Areas (MSOAs) and local authorities. The IMD score is rebased by summing LSOA scores multiplied by population and then dividing by total population.

Using R I constructed simple scatter plots with a regression line and 95% confidence limits for both MSOA and Local authorities.

Number of Fast Food outlets (normalised) vs calculated
Index of Multiple Deprivation for Middle Super Output Areas

Number of Fast Food outlets (normalised) vs calculated
Index of Multiple Deprivation for Local Authorities
(outlier of City of London excluded)

For comparison the relevant plot from the PHE report is shown below:
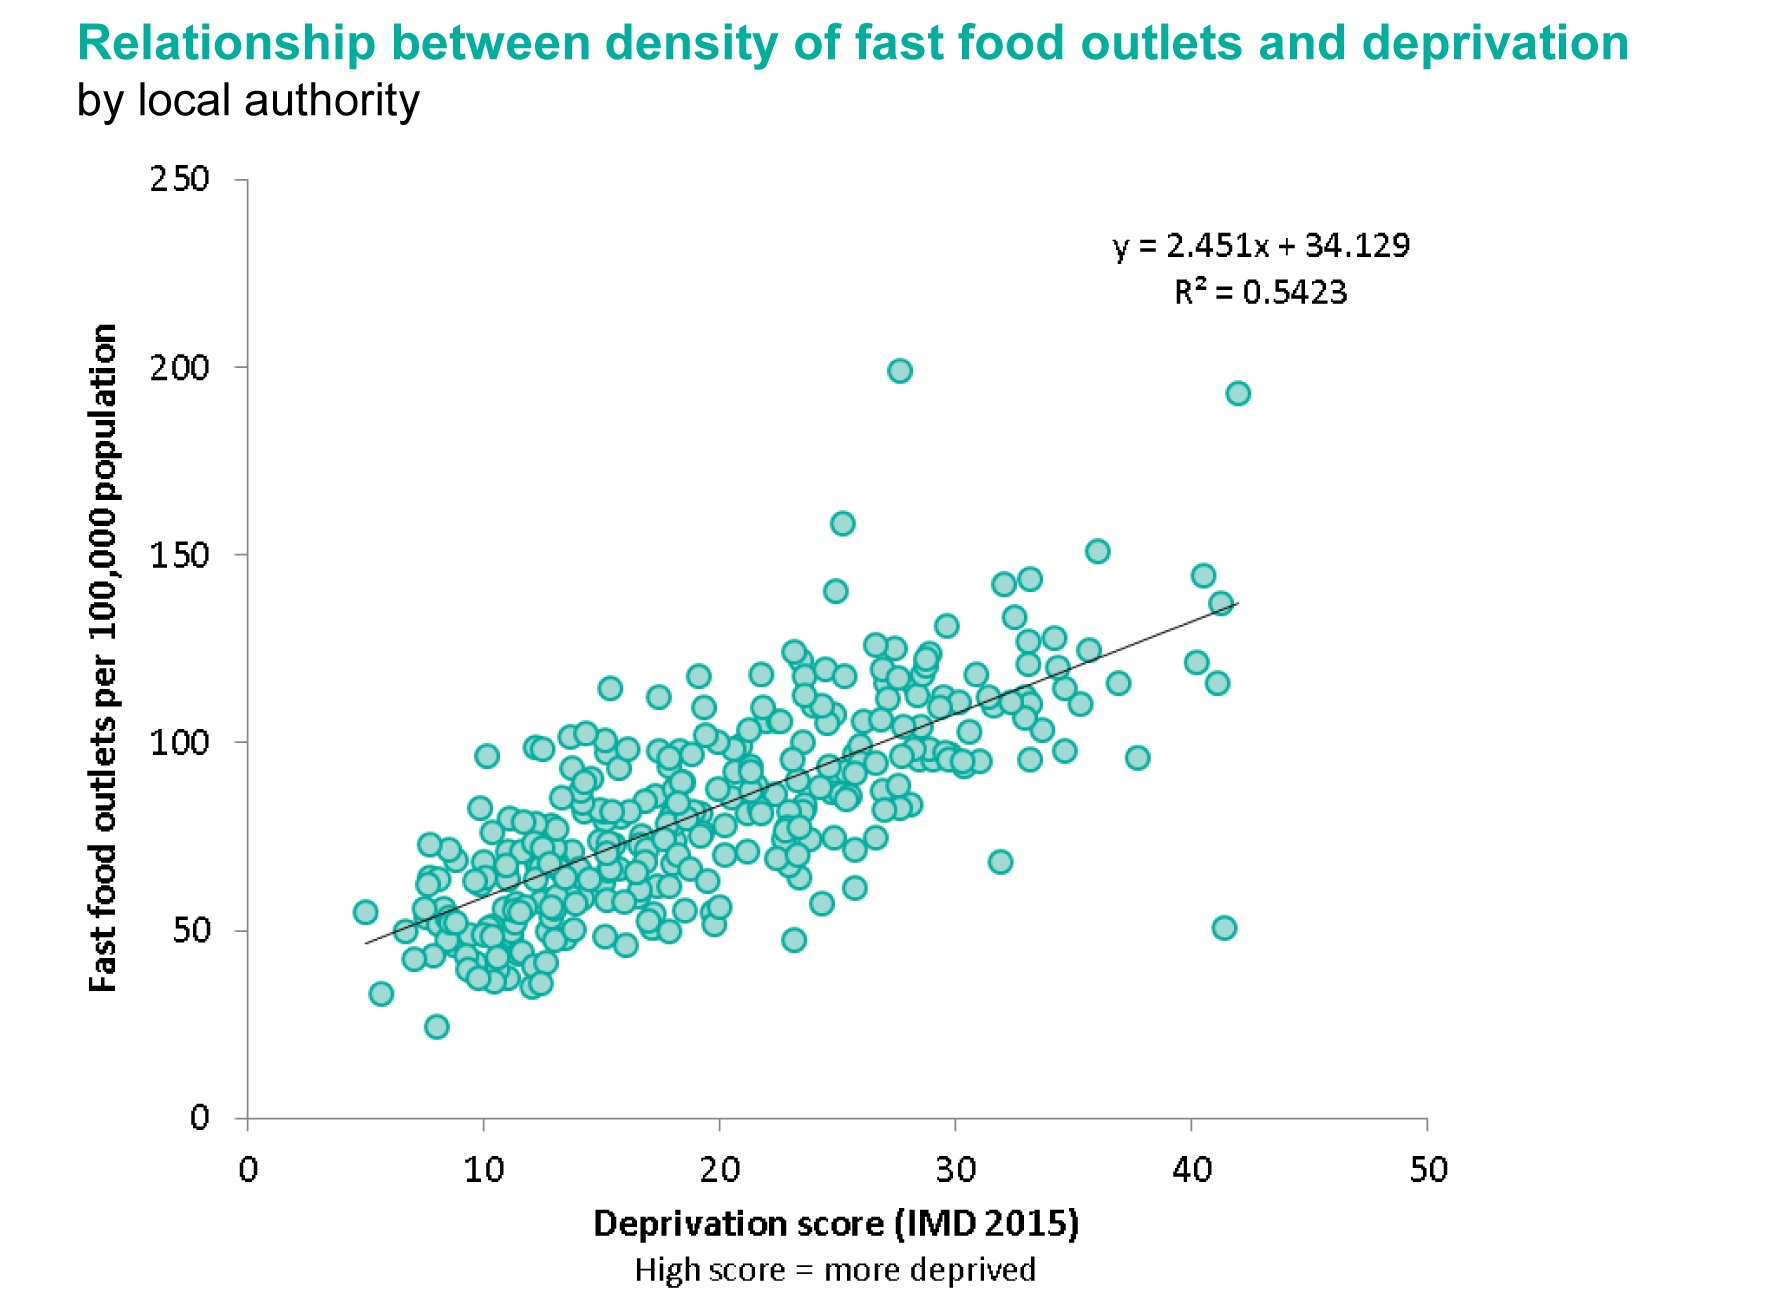
Scatter plot from PHE report for Local Authorities

The final comparison I made was perhaps one I should have done at the outset. Comparing raw counts of fast food outlets from the Open Data source (FHRS) and the PointX data. PHE provided a table of counts at ward level. It took me a while to find a shape file and codes which fitted (the codes change year-on-year), but then it was easy to do a Point-in-Polygon count of the FHRS data for a direct comparison. The correlation of values was plotted in R again.

Comparison of number of Fast Food outlets by 2015 ward boundaries
derived from Food Hygiene Data or from Landmark/Ordnance Survey

Doing this took longer than I hoped: but almost entirely because I don't know my way around the various formats of boundary data related to the census and more changeable boundaries such as the wards.

I haven't done a formal comparison of the outputs, but the visuals presented above strongly suggest that FHRS data is just as useful as the PointX data for this purpose. The main explanation for the lower count coming from FHRS is that the PointX data includes outlets which do food delivery which may include places classified as Restaurants in FHRS.

I had expected more issues with FHRS because there is clearly an under-reporting issue in inner city areas due to rapid turnover of management of takeaways (see the recent Guardian article for an in-depth appreciation of this issue). The other week at the London OpenStreetMap pub meeting in Islington I insisted that we should check the 'scores-on-the-doors' before choosing where to eat our Burritos (a habit I've learnt from Dr Sian Thomas). The three fast food outlets next to the pub didn't feature at all on the FHRS data.

In conclusion: now that FHRS data covers nearly every major authority in the country (Rutland were the last still hold out) it is entirely suitable for a range of statistical purposes.

Monday, 2 December 2013

Harry we missed you! London OSM Hack Weekend

IMG_7023
Thura (half out of picture, sorry), Dan, Matt and Shaun do a "Harry"
I attended my first ever OSM Hack event over the weekend. I knew I needed to be down in South East England around the end of November so I managed to schedule my plans to include the hack event at AOL/MapQuest London offices. My own contribution was slight because I was still sorting out moving data from my old laptop to my new one, and didn't really achieve this until Sunday morning.


Andrew, Thura, Dan, Matt, Shaun, Grant, Serge, Mick, me (standing), Jon
(photo Simon, Cyclestreets)
The rest of this post is merely a collection of quick bullet points about things which happened, were talked about and so over the two days.
  • The major thing that was done on the Saturday was updating the main OSM website: most OSM users should have noticed these changes by now. Not everyone is happy (although this is a given for any change on the OSM site), and following SomeoneElse's comments about the browse pages I have to agree with him that giving the map more space reduces the usefulness of these pages. However, I am equally sure that most glitches will get ironed out quite quickly.

  • Dan worked on getting offline maps running on Firefox phones. (Several of us were interested in Dan's digitizing tablet too).

  • Dan, and perhaps others, did some work on the HOT OSM Tasking Manager.

  • Frederik brought a case of Club Mate along. To my surprise I found it quite palatable.

  • Half of OSM London are getting married next year. Congratulations to Shaun and Andrea, Harry and Francine, & Derick and Morag.

  • Simon, Shaun and I had a long chat about whether OSM can be used for sensible multi-modal transport planning.

  • Robert was working on That Shouldn't be Possible, his nifty tool for finding bad map data by comparing OSM data with real GPS traces of routes.

  • Serge, Robert, Grant and I had a passionate, but I hope, good-natured, debate about the FDA requirement that 23andMe's DNA sequence kits need to be licensed. I plan to blog about genetics, open data, big data and related topics real soon now: it was an opportunity to rehearse some of my arguments.

  • Kat Arney - embryologist, science communicator, journalist, harpist, and knitter - was around on Saturday morning. She interviewed most of us: so one or two of the more coherent statements may appear on a BBC Radio programme in the New Year. Her parting shot when the pizza arrived was that we lived up to all the stereotypes of hackers! (Male, Club Mate drinking, pizza eaters.)

Food Hygiene postcodes buffered to 100m matched to OSM named highways.
(Note NG8 2AE which does not find any highways).
(Image contains copyright Ordnance Survey, Royal Mail and OpenStreetMap open data)
  • MickO and I made a start on working with Food Hygiene Open Data. Mick wrote a parser for the XML and then generated a shape file from a subset of the data. I (eventually) managed to match FHRS postcodes to CodePoint Open postcodes and then find all OSM streets within 100 metres. Mick tried inputing the FHRS data into Nominatim, but for some reason Nominatim won't match the full addresses from FHRS. (I regard this dataset as an excellent exemplar for trying out a host of issues with fuzzy matching of OSM data to external data and conflation).

  • A wikipedian, whose name I didn't catch, visited late on Sunday afternoon. Like Kat, who has written a chapter about my former boss in a forthcoming book, he has been involved in improving the coverage of the work of female scientists in public media. (Wikipedia have an initiative and a lot of work was done recently on Ada Lovelace day). He wanted advice on what information he could collect and in particular about geotagging photos.
MapQuest (Matt) looked after us well, and we had a couple of enjoyable (and not particularly boozy) sessions in pubs in the evening. All-in-all a very interesting and diverse couple of days. Look forward to doing it again late January, early February.

Friday, 28 June 2013

The Shopping News: mapping retail outlets in Nottingham

Nottingham Open Data 6


ng_retail__detail20130613
Nottingham City Centre retail areas with mapped retail units
(shops, banks, pubs, restaurants, cafes, fast food outlets etc.;
the large areas are shop=mall (an unsatisfactory tag)).

ng_retail_20130613
Retail landuse and retail outlets in the city of Nottingham
(a buffer is used to accentuate smaller retail outlets)

This morning I achieved one of my targets for using Nottingham Open Data. This was 90% reconciliation of the Licensed Premises dataset (this compares with around 40% when I first blogged about it).

Tabulation of reconciliation of Nottingham Open Data Licensed Premises File vs OSM
(loaded as an image because turning my Excel stuff into an HTML table is a PITA).
It seems like a good time to take stock (pun intended) of my retail mapping within the city of Nottingham.

ncc_miss_lic_pcs_20130628
Licensed premises from Nottingham Open Data not reconciled to OpenStreetMap
(plotted as number of premises at postcode centroid) cf. with original map.
I started doing this when my mother asked me to take her to church and I realised that I could do a short productive mapping session whilst she was at the service. For the following 2-3 Sundays I mopped up as much as I could in the area close to her Church. Then at the end of April I got serious and instead of doing my shopping locally I drove to other groups of shops when I had an errand. In this way I've visited the majority of local shopping areas (with two major gaps: Mansfield and Carlton Roads).

Most mapping sessions have been just over an hour in length, mainly involve photo mapping and seem to generate a huge amount of data. With a small number of exceptions in the City Centre I haven't done repeat surveys. Apart from trying to take lots of photos I have not tried to map everything I came across, which has been my usual approach in the past. I started doing this on my first outing, and took 30 minutes before I mapped my first shop, and had only 10 minutes for other shops, so I was going to take forever doing it my old way. So I stopped worrying about grabbing everything and just tried to get shops, but did collect other information if it was convenient and readily accessible.

I distinguish between these two styles of mapping, by analogy with farming, as intensive and extensive. In one we put all our efforts into maximising yield (of crop, or OSM data) from a small number of hectares; in the other we are happy if the yield is good enough.

What I've done.

  • Added postcodes to as many as 5,000 objects. (It's a little difficult to check as I have touched objects which already had postcodes).
  • Added around 1,200 different postcodes, about 20% of the city. (Again some may have already been present.)
  • Added around 5,800 housenumbers. These are not just retail premises, but houses close to shopping areas, and when I've walked along streets I've tried to add house numbers at intersecting streets.
  • Added over 2,500 buildings.
  • Taken 7,000 photos. Of which around 6000 are now available on OpenStreetView.
  • Recorded about 13 hours of mapping audio.
  • Loaded around 200 kilometers of GPX tracks.
What I've still to do.
  • Finish adding POIs for shops (particularly in the City Centre).
  • Indoor mapping in the two main Shopping Centres (Malls) in the middle of the city.
  • Finish adding building outlines in the retail landuse polygons (I'm tending to do smaller ones first)

Things I've learnt (and why)

  • Map all shops in a group together. If a single shop changes use or closes and the row of shops has been mapped it is often impossible to reconcile which shop has been affected. It's far better to be systematic for a small area than mapping patchily. Exceptions can be made for very recognisable buildings or POIs. (This also helps check that POIs are in the correct location, see below).
  • Open Data Addresses are great. The Open Data is not accurately geo-located (only to postcode), but it does contain the address. This meant that as long as I could locate the business on Bing aerials I did not need to collect detailed address data. This made surveying less arduous. 
  • Good high-quality building outlines help. A single building outline covering a whole block is useless. A lot of Nottingham City Centre had building polygons mapped not from aerial photography but from OSGB StreetView. Firstly the building outlines were not very accurate. Secondly, it is very time consuming to divide and correct such amorphous polygons.
  • Good photos and; decent aerial photos are critical. I have taken a huge number of photos (all available on OpenStreetView) to assist this mapping. I try and get photos of the roof line as I can correlate chimneys, dormer windows and other roof-line features between the aerial photos and my street level ones. It is amazingly easy to displace a POI a few tens of metres even with all this information.
  • Android Apps aren't much use in a City Centre. I made some use of KeyPadMapper3, but found the data often needed to be tweaked because my android phone GPS location wasn't too good. In the City Centre the canyon effect even with a Garmin is too much. A further reason not to use the phone is that I was already using a camera, two GPS (one in the backpack) and a digital voice recorder, juggling these and the phone was too much. The phone did come into it's own when the batteries ran out on the dictaphone. In the end I used the voice recorder for most addresses I collected. I didn't try Vespucci.
  • History of POIs is enormously helpful. Most of the errors in the Open Data are failures to update historical data (POIs closing, changing ownership, re-branding, or moving elsewhere). In many cases Nottingham mappers have kept the historical information when updating POIs, and this means that it's mush easier to reconcile OSM with the Local Open Data.
  • It's really difficult to tell if some POIs are still open. See the associated post on Vanishing Pubs.
  • Night-time surveying is the only way to check the status of some Bars, Nightclubs and Fast Food outlets. I'm too old to be a night owl, so someone else needs to do this.
  • POIs change fast. (Well I already knew this) My re-surveying of Market Street, Mansfield Road and Upper Parliament Street/Forman Street, which were all done 2 years ago by Paul Williams enables the rate of change to be quantified.
  • A 5% error rate in local government open data seems a reasonable assumption. This is not too different from rates found with NaPTAN and Ordnance Suryey Open Data Locator. It does mean that it's far better to use this data as the basis for survey (as we have done with Locator) rather than import (as was done with NaPTAN).
  • Local Government Open Data needs significant interpretation. It is collected for discrete purposes, and there is no integration across data sets. I presume licences are granted for a number of years. Therefore there are no checks as to whether the licence is still in use, or even has ever been used, until renewal time.
  • Extensive surveying is more fun, and less exhausting, than intensive surveying. By an intensive survey I mean one intended to collect all types of mapping data in a discrete area. Extensive surveying involves covering a larger area perhaps with some specific targets, but most information is collected as a side product rather than with deliberation.
  • It was a good mapping project. A targeted set of POIs makes for a reasonable mapping project over a shortish term.
  • More Systematic Coverage. Extensive surveying means more systematic coverage of the city: even if not in great detail.

What to do next

The next steps are fairly obvious. 

  • Repeat for Food Hygiene Data. I have an additional data source from the City Council which covers POIs which serve food (anything from fast food outlets to schools and hospitals). This is about twice the size of the Licensed Premises file (2400+ cf. 1200 POIs) and at the moment I have only reconciled 70% of the data. In the main this means checking more day nurseries, care homes and similar establishments.  

  • ncc_miss_fhrs_20130628
    Premises from Nottingham Open Data Food Hygiene file
    not reconciled with OpenStreetMap (cf. with image above).


  • Change Detection. Build a mechanism for automatically detecting change in the source data. So far I have just used a snapshot of the data, but it would be very useful to find changes in the source data files and use them to drive surveys.

  • Create additional tools for Food Hygiene data. The Food Hygiene data is actually available for many parts of the UK and is Open Data. There are at least 350,000 POIs available. It is usually safe to assume that it is accurate at the postcode level, but in the nature of retail outlets several are usual present in each postcode. It would be nice to be able to create layers for mapping (e.g., in JOSM, Potlatch etc) which spread the FHRS POIs out around their postcode location preferably ordered by housenumber in the right direction. It would also be good to be able to load subsets of this data as POIs or similar into Garmin or Android devices.

  • Developing sensible categories for retail. In some of the images in this blog post I have used an ad hoc categorisation of available amenity=* and shop=* values. It would be useful to develop a more considered version of these categories.

Conclusion

The most important thing is that this project would never have started without the availability of Local Government Data. Although I could have tried to find and map retail outlets I would have missed many isolated ones, and would have had no idea how many more there were to find.

With retail data mapped systematically it becomes possible to evaluate exactly how we use tags and if there are any obvious improvements. Remember that Nottingham is the 8th largest retail centre in the United Kingdom and is therefore a reasonable exemplar for all but the largest retail centres in Europe and North America.

A consequence of trying to be systematic is that I have visited areas of the city which have had very little on-the-ground mapping. I have been able to collect other POIs, addresses, correct road alignments etc.

Lastly, this is a very productive and rewarding means of mapping. If you have any local open data on shops I recommend a bit of Retail Therapy.