 | |
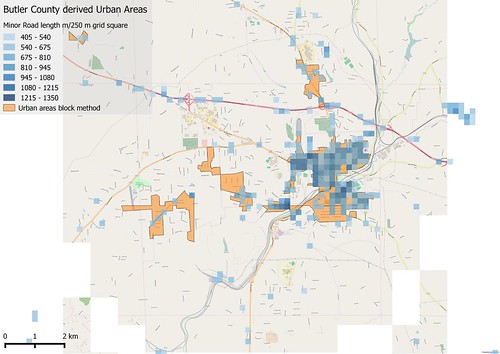
| Comparison of Urban Areas derived using "block method" and gridded road density. Only grid squares with over 500 m of road included. The area shown is around Butler, Butler Co, PA |
Sunday, 15 November 2015
Urban Areas 4 : Derivation from OpenStreetMap using road density
Another variation on the theme from the last post: this time looking for some measure of road density.
The easiest way is to sum road lengths in individual cells. The cells have to be quite small (say 250 metre square) to achieve the resolution desired. I've excluded link roads and motorway & trunk highway classed in this calculation.

Saturday, 14 November 2015
Urban Areas 3 : derivation from OSM using residential blocks
 |
| View S from the Cathedral of Learning in Oakland, Pittsburgh, showing some urban areas used as tests in this post.
The incised valley of the Monogahela in the background contained railways and steel works. The plateau beyond has residential suburbs of Pittsburgh. To the left foreground are the woods and ravines of Schenley Park, with a residential area beyond. Source: Zack Weinberg via Wikimedia Commons CC-BY-SA
|
One of the obvious features of the highway network for the USA on OpenStreetMap is that road density is much higher in built-up areas. I started looking at how to measure this, when I recalled a method for identifying city blocks introduced to me by a Brazilian user of OpenStreetMap data.
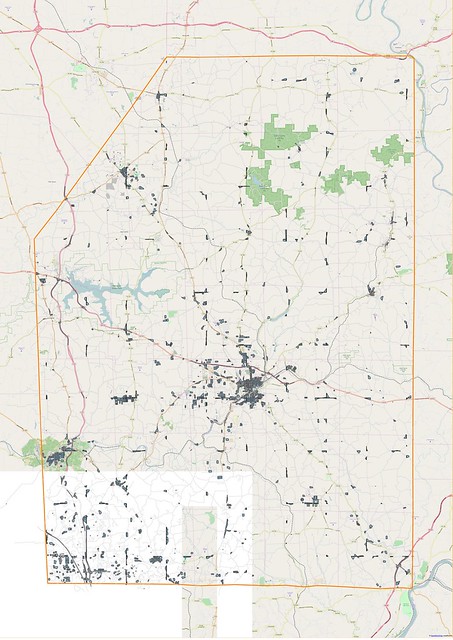 |
| Residential Areas for Butler Co, Pennsylvania, identified with the block method from OpenStreetMap data. Orange line outlines Butler County. |
The method itself is also really quite simple:
- Take the main road network for some area and make a union of it (which will be a MULTILINESTRING).
- Polygonize this data, and decompose to individual polygons.
Thursday, 12 November 2015
Urban Areas 2 : Derivation from OpenStreetMap using Residential Roads
 |
| Street corner, Retiro, Buenos Aires (Libertad/ Juncal) CC-BY-SA, the author |
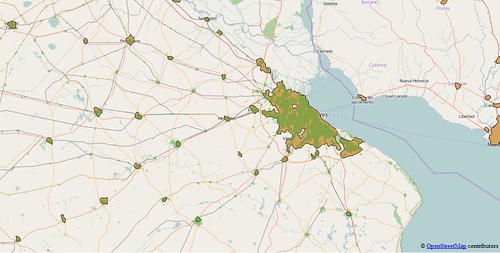 |
| Buenos Aires and hinterland, showing comparison between urban polygons derived from OSM (green) and the Natural Earth data (light brown). |
I have chosen the following places as suitable test areas for these investigations:
- East Midlands of England. Not only my home turf, but also a well-mapped area with extensive use of landuse tags, and in excess of 99% of all residential roads. In addition Ordnance Survey Meridian 2 Open Data contains a layer corresponding to urban areas which provides an excellent control for checking results from this area.
- Pakistan. Not only one of the most populous countries in the world, but one of the least well mapped in OpenStreetMap. Pakistan is a likely candidate for cities which are barely mapped. I would also expect other very populous Asian countries (notably China, India and Bangladesh) which are poorly mapped to be similar to Pakistan.
- Nigeria. Similar criteria to Pakistan: the most populous country in Africa. The .pbf file for Nigeria is approximately 50% larger than that for Pakistan, but both are smaller than that for Lesotho with a population of 2 million compared to 180 million (Nigeria) and 200 million (Pakistan).
- Côte d'Ivoire. Close to Nigeria, but a place which I know has an active OSM community. Quite a number of mapping activities. (Note to Geofabrik, it's not called the Ivory Coast any more).
- Argentina. Latin American cities are often laid out in a grid, nowhere more so than in Argentina. The prevalence of the grid system, and my believe that the urban road system is largely complete were reasons for choosing this as a Latin American example. My own experience of travelling in Argentina after SotM-14 suggests that, for the most part, urban road systems are mapped. One known gap, the newer western suburbs of Ushuaia has recently been rectified by the kind provision of aerial imagery from the Argentine National mapping agency.
- Pennsylvania. It was essential to include some US data because of the TIGER import problem: all rural roads being tagged residential. Since I spent part of my childhood in Pennsylvania it is also a place I know and which I have edited (sporadically) to improve the rural road network.
Sunday, 25 October 2015
Urban Areas: a meditation on why simple global geographical datasets are so poor
 | ||
| Puerto Vallarta, an aerial view of an urban area missing many roads on OpenStreetMap. The area in the middle distance away from the sea was particularly lacking. Fortunately the centre of the hurricane didn't pass over this area. Source: Wikimedia Commons, (c) CC-BY-SA |
The other night, as Hurricane 'Patricia' bore down on the Pacific coast of Mexico, I had a twitter conversation with Bill Morris and others regarding how well mapped Puerto Vallarta was on OpenStreetMap. (BTW: I'm sure it's much better mapped now).
Latin America is a weak spot for @openstreetmap. A town in the #Patricia track: https://t.co/pk4UYHHan3 pic.twitter.com/3t7ZQkWkWz
— Bill Morris (@vtcraghead) October 23, 2015
Of course, OSM is about fixing things, so I carried out the conversation in between adding around a hundred streets to the city. However the really interesting question was this one:
@vtcraghead @hotosm @openstreetmap Would there be some sort of algorithm that can be run to detect built up areas from imagery not mapped?
— Antonio Locandro (@antoniolocandro) October 23, 2015
Whilst at breakfast I thought a little more about this. I decided it ought to be possible to do something fairly simple with data which already exists.
Friday, 16 October 2015
Irish Vice Counties : the creation of a specific dataset on OpenStreetMap
I've been meaning to write about OpenStreetMap Ireland's townland mapping project for some time.
It's a wonderful example of how historical maps are of significant value in creating really useful data on OpenStreetMap which is just as relevant as it today as was in the past.
The immediate reason for writing about them is that I have been creating vice county boundaries for Ireland. In doing so I have not just been using the data, but the fantastic range of resources made available through the activities of the townlands project.
It's a wonderful example of how historical maps are of significant value in creating really useful data on OpenStreetMap which is just as relevant as it today as was in the past.
The immediate reason for writing about them is that I have been creating vice county boundaries for Ireland. In doing so I have not just been using the data, but the fantastic range of resources made available through the activities of the townlands project.
 |
| The Vice Counties of Ireland My first complete draft of the boundaries on OpenStreetMap |
Wednesday, 16 September 2015
Plantations : woods, forests or something else?
 |
| Poplars at Lakenheath CC-BY-SA 2.0 © Copyright Alison Rawson and licensed for reuse under this Creative Commons Licence. |
Plantations run the gamut from small areas to fully-fledged forests. In general what connects them is that the trees are planted in orderly rows, and the plantation has an expected lifetime, after which the trees will be harvested or replanted. Photographs enable some of the variety to be shown. In turn this should highlight the sorts of information we might want to capture by OpenStreetMap tags.
Thursday, 10 September 2015
Why does The Guardian think that OpenStreetMap is owned by Google
My attention was drawn by a tweet to an article in The Guardian online showing some nice examples of cartography:

To quote "Google's OpenStreetMap"!
Now, The Guardian has generally covered OpenStreetMap well over the years, and has made use of appropriately credited OSM data from time-to-time over the years. Last year it re-published Serge Wroclawski's influential blog post "Why the world needs OpenStreetMap". It's former Technology editor, Charles Arthur, was very familiar with OpenStreetMap, and in turn played a big part in the campaign to get open data from the Ordnance Survey.
This error is symptomatic of two things:
A quick google search reveals more or less the identical string in numerous webpages referring to Luis Dilger's 3-D city visualisations:
Thankfully I got a speedy response from them (thanks to twitter):
— Ordnance Survey (@OrdnanceSurvey) September 10, 2015
To my amazement it contained this:
To quote "Google's OpenStreetMap"!
Now, The Guardian has generally covered OpenStreetMap well over the years, and has made use of appropriately credited OSM data from time-to-time over the years. Last year it re-published Serge Wroclawski's influential blog post "Why the world needs OpenStreetMap". It's former Technology editor, Charles Arthur, was very familiar with OpenStreetMap, and in turn played a big part in the campaign to get open data from the Ordnance Survey.
This error is symptomatic of two things:
- A widespread assumption that anything to do with on-line maps must come from Google (most often seen in the belief that the images are taken with Google's own statellites).
- An absence of care in fact-checking when taking information from other webpages.
A quick google search reveals more or less the identical string in numerous webpages referring to Luis Dilger's 3-D city visualisations:
- Full Scream
- Design Collector credited to Arseny Verishin
- Trogue not credited
- Fubiz not credited
- and many more
Thankfully I got a speedy response from them (thanks to twitter):
@SK53onOSM thanks for pointing that out - the caption's been amended now
— Gdn Readers' editor (@GdnReadersEd) September 10, 2015
All-in-all the episode highlights that as a group we in OpenStreetMap have a long way to go in communicating who we are and what we do to mainstream media types.
Subscribe to:
Posts (Atom)

