Wednesday, 2 December 2015

How accurately have Townlands in Northern Ireland been mapped?

From time-to-time newly released Open Data provides a nice opportunity to check OpenStreetMap for its accuracy in all its forms (see Hakaly (2008) for a breakdown of what this can mean).

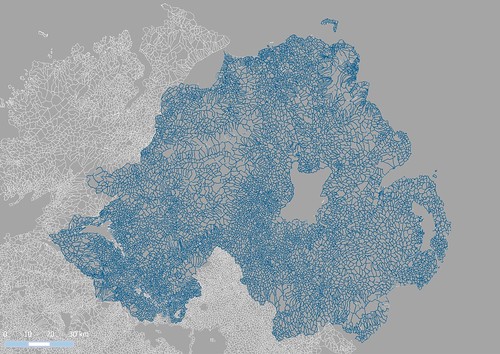
Coastal Townlands, Cos. Derry & Antrim
Coastal Townlands, Counties Derry/Londonderry and Antrim.
Boundary lines see below. The deeper the colour of the area, the greater discrepancy in the area of the OSM polygon and the OSNI one. The pale base colour represents a divergence of under 2%. Townlands on the coast and on the UK/Ireland border seem to  be most likely to diverge in size. The small cluster centre right is caused by different ways of handling townlands which cross a Civil Parish boundary (OSM & the original source GSGS 3906 split these, the OSNI data does not).
We have known for a while that both the Ordnance Survey of Northern Ireland and the Ordnance Survey of Ireland were planning OpenData releases. When they came it was all in a rush. For now the hard work starts of checking license conditions for suitability for use in OSM and other places, as well as then working out what is really useful. However, because the townland boundaries of Northern Ireland are complete, it was an ideal opportunity to look at accuracy.

View along N side of MacGilligan Peninsula towards Inishown from Umbra

My reasons for doing this are not just pure interest. The usefulness of the Irish Vice County boundaries depends of their positional accuracy. Earlier my prediction was that such boundaries ought to be within 10 metres of their true location on the ground where they were based on townland boundaries, but this was largely based on experience with other OSM data rather than an objective statement. Thus investigating the accuracy using an independent data set provides an excellent way of testing this statement. The tests need to be done now, because (as we shall see) the nature of OSM is to fix issues spotted very quickly, and thus datasets become loosely coupled.

I adopted two approaches:
  1. A straight comparison of areas (or their ratios).
  2. Using a series of buffered boundaries from one source (OSNI) and seeing what proportion of the other source (OSM) was included in each buffer.
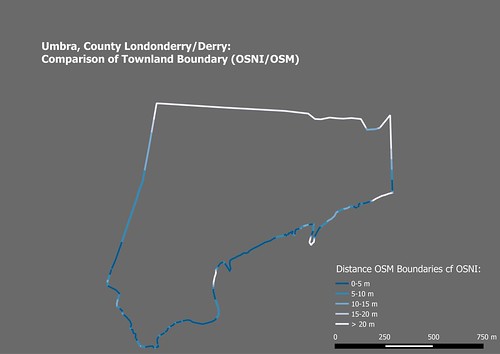
To choose which townlands to compare I followed a suggestion of Rory McCann and for each OSM townland selected the one which shared the most area in common from the OSNI data set. (I have also done it on matching names for a smaller set of data & get similar results). Note that I am comparing townland with townland, not boundary segment with boundary segment. This means that each boundary segment (other than coastal, lacustrine or riverine ones) will be included twice.

umbra_townland_cf
Buffering approach to investigating boundary accuracy.
Demonstrated with Umbra townland in County Derry/Londonderry.
This is predominantly coastal sand dunes, with a small river running along its S boundary.
Northern Ireland Townlands OSNI comparison
Northern Ireland using the same colouring.
At this scale very few boundary mismatches are apparent.
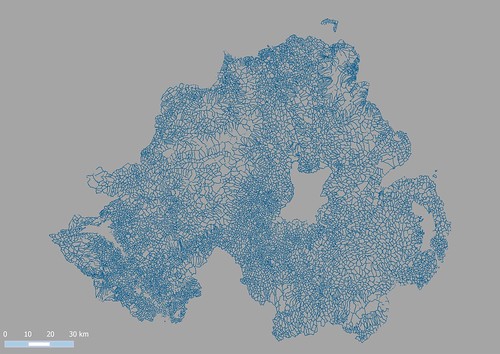
The buffering approach is based on that described by Hakaly (2008). I used buffers of 5, 10, 15 and 20 m, and then clipped the initial OSM way be each in turn.  On the scale of the whole country it is clear that most boundaries match closely. This is confirmed by checking what proportion of the boundaries fall into each buffer class: over 80% are within 5m, over 90% within 10m and nearly 95% within 20m.


Closer inspection (as with the Umbra) shows much of the discrepancy to be present along the coast. This is not surprising, coastlines on OSM were originally derived automatically, and even when refined by hand are unlikely to accord with Mean High Water (MHW). Certainly, for my purposes, it is merely important that the OSM coastlines do not stray above MHW.

NI Townlands, all boundaries within 5 m of OSNI
OSM townland Boundaries within 5m of OSNI data
The analysis described so far focusses on positional accuracy. Looking at areas highlights a range of other accuracy issues.

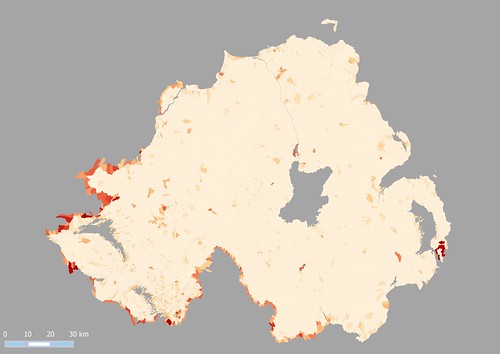
townlands_ni_cf9
Area comparison. Townlands are coloured according to absolute variance of ratio of areas from 1.
The redder they are the further the ratio is from 1.
Area discrepancies of over, say 5%, may be the result of any of the following:
  • Boundary discrepancy (such as coastlines). Mainly caused by coastlines, or difficulty of delineating some boundary feature, such as the course of the Umbra river above) 
  • Erroneous interpretation of the boundary on old maps causing selection of the wrong feature. This transfers land from one townland to another, therefore these should cluster. 
  • Missing townlands. When a single townland has been created without noticing one or more others inside it (Town Parks townland at Ballymoney is an example). 
  • Different treatment of townlands bisected by a Civil Parish. See caption of first image above. Incorrect tagging. 
  • Higher level administrative units having tags appropriate to a townland. I've noted two cases of this one of which was Ballyphilip CP on the Ards peninsula in County Down. 
  • Islands. Some offshore islands appear to be missing from the OSNI data (see The Skerries N of Portrush)
We've already caught a few examples in each of these classes through this analysis, and no doubt will find a few more. I have not yet investigated the very apparent discrepancy along the borders.

To conclude, townland boundaries show exactly the kind of positional accuracy we expected (or perhaps hoped). Perhaps 1% of the total data (90-100 townlands from about 9000) may need some form of correction. I'm biased, but this seems pretty good, for a project principally relying on rectified photo-reduced maps from 1939! It's also worth remembering, that unlike road comparisons, there is no widely available sensor data (ie GPS tracks/point) to help boundary alignments.

When time permits I'll extend this to include OSI Open Data too. A big thanks to both organisations for releasing their Open Data. OSNI staff have been contributors to OSM for a while: they host Missing Maps lunchtime sessions in their offices.

How accurately have Townlands in Northern Ireland been mapped?

From time-to-time newly released Open Data provides a nice opportunity to check OpenStreetMap for its accuracy in all its forms (see Hakaly (2008) for a breakdown of what this can mean).

Coastal Townlands, Cos. Derry & Antrim
Coastal Townlands, Counties Derry/Londonderry and Antrim.
Boundary lines see below. The deeper the colour of the area, the greater discrepancy in the area of the OSM polygon and the OSNI one. The pale base colour represents a divergence of under 2%. Townlands on the coast and on the UK/Ireland border seem to  be most likely to diverge in size. The small cluster centre right is caused by different ways of handling townlands which cross a Civil Parish boundary (OSM & the original source GSGS 3906 split these, the OSNI data does not).
We have known for a while that both the Ordnance Survey of Northern Ireland and the Ordnance Survey of Ireland were planning OpenData releases. When they came it was all in a rush. For now the hard work starts of checking license conditions for suitability for use in OSM and other places, as well as then working out what is really useful. However, because the townland boundaries of Northern Ireland are complete, it was an ideal opportunity to look at accuracy.

View along N side of MacGilligan Peninsula towards Inishown from Umbra

My reasons for doing this are not just pure interest. The usefulness of the Irish Vice County boundaries depends of their positional accuracy. Earlier my prediction was that such boundaries ought to be within 10 metres of their true location on the ground where they were based on townland boundaries, but this was largely based on experience with other OSM data rather than an objective statement. Thus investigating the accuracy using an independent data set provides an excellent way of testing this statement. The tests need to be done now, because (as we shall see) the nature of OSM is to fix issues spotted very quickly, and thus datasets become loosely coupled.

I adopted two approaches:
  1. A straight comparison of areas (or their ratios).
  2. Using a series of buffered boundaries from one source (OSNI) and seeing what proportion of the other source (OSM) was included in each buffer.
To choose which townlands to compare I followed a suggestion of Rory McCann and for each OSM townland selected the one which shared the most area in common from the OSNI data set. (I have also done it on matching names for a smaller set of data & get similar results). Note that I am comparing townland with townland, not boundary segment with boundary segment. This means that each boundary segment (other than coastal, lacustrine or riverine ones) will be included twice.

umbra_townland_cf
Buffering approach to investigating boundary accuracy.
Demonstrated with Umbra townland in County Derry/Londonderry.
This is predominantly coastal sand dunes, with a small river running along its S boundary.
Northern Ireland Townlands OSNI comparison
Northern Ireland using the same colouring.
At this scale very few boundary mismatches are apparent.
The buffering approach is based on that described by Hakaly (2008). I used buffers of 5, 10, 15 and 20 m, and then clipped the initial OSM way be each in turn.  On the scale of the whole country it is clear that most boundaries match closely. This is confirmed by checking what proportion of the boundaries fall into each buffer class: over 80% are within 5m, over 90% within 10m and nearly 95% within 20m.


Closer inspection (as with the Umbra) shows much of the discrepancy to be present along the coast. This is not surprising, coastlines on OSM were originally derived automatically, and even when refined by hand are unlikely to accord with Mean High Water (MHW). Certainly, for my purposes, it is merely important that the OSM coastlines do not stray above MHW.

NI Townlands, all boundaries within 5 m of OSNI
OSM townland Boundaries within 5m of OSNI data
The analysis described so far focusses on positional accuracy. Looking at areas highlights a range of other accuracy issues.

townlands_ni_cf9
Area comparison. Townlands are coloured according to absolute variance of ratio of areas from 1.
The redder they are the further the ratio is from 1.
Area discrepancies of over, say 5%, may be the result of any of the following:
  • Boundary discrepancy (such as coastlines). Mainly caused by coastlines, or difficulty of delineating some boundary feature, such as the course of the Umbra river above) 
  • Erroneous interpretation of the boundary on old maps causing selection of the wrong feature. This transfers land from one townland to another, therefore these should cluster. 
  • Missing townlands. When a single townland has been created without noticing one or more others inside it (Town Parks townland at Ballymoney is an example). 
  • Different treatment of townlands bisected by a Civil Parish. See caption of first image above. Incorrect tagging. 
  • Higher level administrative units having tags appropriate to a townland. I've noted two cases of this one of which was Ballyphilip CP on the Ards peninsula in County Down. 
  • Islands. Some offshore islands appear to be missing from the OSNI data (see The Skerries N of Portrush)
We've already caught a few examples in each of these classes through this analysis, and no doubt will find a few more. I have not yet investigated the very apparent discrepancy along the borders.

To conclude, townland boundaries show exactly the kind of positional accuracy we expected (or perhaps hoped). Perhaps 1% of the total data (90-100 townlands from about 9000) may need some form of correction. I'm biased, but this seems pretty good, for a project principally relying on rectified photo-reduced maps from 1939! It's also worth remembering, that unlike road comparisons, there is no widely available sensor data (ie GPS tracks/point) to help boundary alignments.

When time permits I'll extend this to include OSI Open Data too. A big thanks to both organisations for releasing their Open Data. OSNI staff have been contributors to OSM for a while: they host Missing Maps lunchtime sessions in their offices.

Sunday, 15 November 2015

Urban Areas 4 : Derivation from OpenStreetMap using road density

Another variation on the theme from the last post: this time looking for some measure of road density.


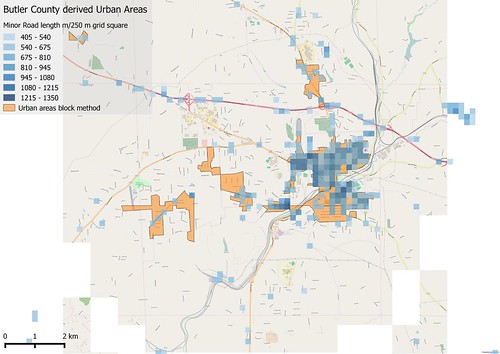
Butler Co, PA: derived Urban Areas
Comparison of Urban Areas derived using "block method" and gridded road density.
Only grid squares with over 500 m of road included.
The area shown is around Butler, Butler Co, PA

The easiest way is to sum road lengths in individual cells. The cells have to be quite small (say 250 metre square) to achieve the resolution desired. I've excluded link roads and motorway & trunk highway classed in this calculation.


Saturday, 14 November 2015

Urban Areas 3 : derivation from OSM using residential blocks

FromCoL 8234828991
View S from the Cathedral of Learning in Oakland, Pittsburgh,
showing some urban areas used as tests in this post.
The incised valley of the Monogahela in the background contained railways and steel works. The plateau beyond has residential suburbs of Pittsburgh. To the left foreground are the woods and ravines of Schenley Park, with a residential area beyond. Source: Zack Weinberg via Wikimedia Commons CC-BY-SA

One of the obvious features of the highway network for the USA on OpenStreetMap is that road density is much higher in built-up areas. I started looking at how to measure this, when I recalled a method for identifying city blocks introduced to me by a Brazilian user of OpenStreetMap data.

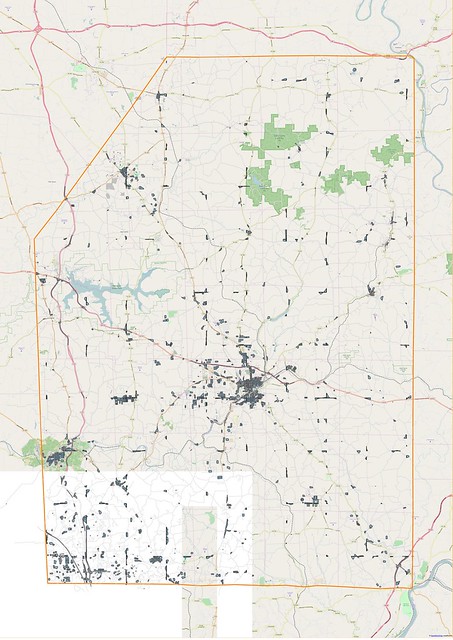
butler_co_urban_blocks
Residential Areas for Butler Co, Pennsylvania, identified with the block method
from OpenStreetMap data. Orange line outlines Butler County.
My idea was simple, a greater road density implies smaller areas for the polygons enclosed by a set of roads. By choosing some maximum polygon size, one should be able to pick out urban areas.

The method itself is also really quite simple:
  • Take the main road network for some area and make a union of it (which will be a MULTILINESTRING).
  • Polygonize this data, and decompose to individual polygons.
In Lucas' implementation the first step is done by municipal areas. I wanted to try the approach for a whole state without using administrative area data. I therefore once again turned to my trusty standby of using a gridded method.

Thursday, 12 November 2015

Urban Areas 2 : Derivation from OpenStreetMap using Residential Roads

Street corner, Retiro, Buenos Aires
(Libertad/ Juncal)
CC-BY-SA, the author
Following on from my last post I have now been looking in more detail at how one might start using OpenStreetMap (OSM) to create a global dataset of Urban Areas. As OSM does not have any widely used notation for urban areas I have been looking at several ways in which other OSM data can be used to identify such areas prospectively. In this post I look at the use of residential roads (and I'm not the first to do so). Later posts will look at other techniques.

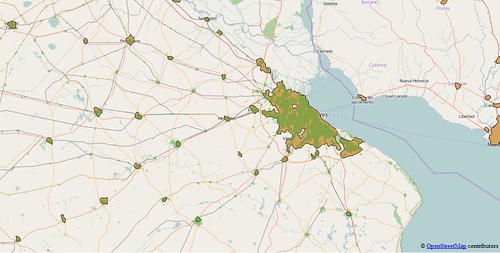
ar_ba_urban2
Buenos Aires and hinterland, showing comparison between urban polygons
derived from OSM (green) and the Natural Earth data (light brown).

I have chosen the following places as suitable test areas for these investigations:
  • East Midlands of England. Not only my home turf, but also a well-mapped area with extensive use of landuse tags, and in excess of 99% of all residential roads. In addition Ordnance Survey Meridian 2 Open Data contains a layer corresponding to urban areas which provides an excellent control for checking results from this area.
  • Pakistan. Not only one of the most populous countries in the world, but one of the least well mapped in OpenStreetMap. Pakistan is a likely candidate for cities which are barely mapped. I would also expect other very populous Asian countries (notably China, India and Bangladesh) which are poorly mapped to be similar to Pakistan.
  • Nigeria. Similar criteria to Pakistan: the most populous country in Africa. The .pbf file for Nigeria is approximately 50% larger than that for Pakistan, but both are smaller than that for Lesotho with a population of 2 million compared to 180 million (Nigeria) and 200 million (Pakistan).
  • Côte d'Ivoire. Close to Nigeria, but a place which I know has an active OSM community. Quite a number of mapping activities. (Note to Geofabrik, it's not called the Ivory Coast any more).
  • Argentina. Latin American cities are often laid out in a grid, nowhere more so than in Argentina. The prevalence of the grid system, and my believe that the urban road system is largely complete were reasons for choosing this as a Latin American example. My own experience of travelling in Argentina after SotM-14 suggests that, for the most part, urban road systems are mapped. One known gap, the newer western suburbs of Ushuaia has recently been rectified by the kind provision of aerial imagery from the Argentine National mapping agency.
  • Pennsylvania. It was essential to include some US data  because of the TIGER import problem: all rural roads being tagged residential. Since I spent part of my childhood in Pennsylvania it is also a place I know and which I have edited (sporadically) to improve the rural road network.
Briefly I expected the following: good urban areas for the East Midlands and Argentina (i.e., better than Natural Earth (NE)); middling to poor for the three developing nations (gaps relative to NE, but in some cases better precision); hopeless for Pennsylvania.

Sunday, 25 October 2015

Urban Areas: a meditation on why simple global geographical datasets are so poor

Puerto-Vallarta
Puerto Vallarta, an aerial view of an urban area missing many roads on OpenStreetMap.
The area in the middle distance away from the sea was particularly lacking.
Fortunately the centre of the hurricane didn't pass over this area.
Source: Wikimedia Commons, (c) CC-BY-SA


The other night, as Hurricane 'Patricia' bore down on the Pacific coast of Mexico, I had a twitter conversation with Bill Morris and others regarding how well mapped Puerto Vallarta was on OpenStreetMap. (BTW: I'm sure it's much better mapped now).
Of course, OSM is about fixing things, so I carried out the conversation in between adding around a hundred streets to the city. However the really interesting question was this one:

Whilst at breakfast I thought a little more about this. I decided it ought to be possible to do something fairly simple with data which already exists.

Friday, 16 October 2015

Irish Vice Counties : the creation of a specific dataset on OpenStreetMap

I've been meaning to write about OpenStreetMap Ireland's townland mapping project for some time.

It's a wonderful example of how historical maps are of significant value in creating really useful data on OpenStreetMap which is just as relevant as it today as was in the past.

The immediate reason for writing about them is that I have been creating vice county boundaries for Ireland. In doing so I have not just been using the data, but the fantastic range of resources made available through the activities of the townlands project.

Irish vice counties ex osm multicolour
The Vice Counties of Ireland
My first complete draft of the boundaries on OpenStreetMap